Students engage in hands-on, true-to-life research experiences on air quality topics chosen …
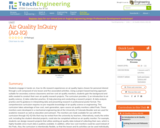
Students engage in hands-on, true-to-life research experiences on air quality topics chosen for personal interest through a unit composed of one lesson and five associated activities. Using a project-based learning approach suitable for secondary science classrooms and low-cost air quality monitors, students gain the background and skills needed to conduct their own air quality research projects. The curriculum provides: 1) an introduction to air quality science, 2) data collection practice, 3) data analysis practice, 4) help planning and conducting a research project and 5) guidance in interpreting data and presenting research in professional poster format. The comprehensive curriculum requires no pre-requisite knowledge of air quality science or engineering. This curriculum takes advantage of low-cost, next-generation, open-source air quality monitors called Pods. These monitors were developed in a mechanical engineering lab at the University of Colorado Boulder and are used for academic research as well as education and outreach. The monitors are made available for use with this curriculum through AQ-IQ Kits that may be rented from the university by teachers. Alternatively, nearly the entire unit, including the student-directed projects, could also be completed without an air quality monitor. For example, students can design research projects that utilize existing air quality data instead of collecting their own, which is highly feasible since much data is publically available. In addition, other low-cost monitors could be used instead of the Pods. Also, the curriculum is intentionally flexible, so that the lesson and its activities can be used individually. See the Other section for details about the Pods and ideas for alternative equipment, usage without air quality monitors, and adjustments to individually teach the lesson and activities.
Students act as R&D entrepreneurs, learning ways to research variables affecting the …
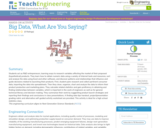
Students act as R&D entrepreneurs, learning ways to research variables affecting the market of their proposed (hypothetical) products. They learn how to obtain numeric data using a variety of Internet tools and resources, sort and analyze the data using Excel and other software, and discover patterns and relationships that influence and guide decisions related to launching their products. First, student pairs research and collect pertinent consumer data, importing the data into spreadsheets. Then they clean, organize, chart and analyze the data to inform their product production and marketing plans. They calculate related statistics and gain proficiency in obtaining and finding relationships between variables, which is important in the work of engineers as well as for general technical literacy and decision-making. They summarize their work by suggesting product launch strategies and reporting their findings and conclusions in class presentations. A finding data tips handout, project/presentation grading rubric and alternative self-guided activity worksheet are provided. This activity is ideal for a high school statistics class.
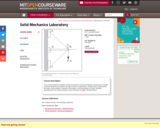
Introduces the concepts, techniques, and devices used to measure engineering properties of …
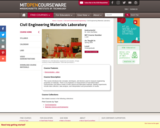
Introduces the concepts, techniques, and devices used to measure engineering properties of materials. Emphasis on measurement of load-deformation characteristics and failure modes of both natural and fabricated materials. Weekly experiments include data collection, data analysis, and interpretation and presentation of results.
As a class, students use a low-cost air quality monitor (a rentable …
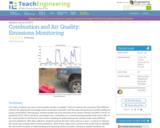
As a class, students use a low-cost air quality monitor (a rentable “Pod”) to measure the emissions from different vehicles. By applying the knowledge about combustion chemistry that they gain during the pre-activity reading (or lecture presentation, alternatively), students predict how the emissions from various vehicles will differ in terms of pollutants (CO2, VOCs and NO2), and explain why. After data collection, students examine the time series plots as a class—a chance to interpret the results and compare them to their predictions. Short online videos and a current event article help to highlight the real-world necessity of understanding and improving vehicle emissions. Numerous student handouts are provided. The activity content may be presented independently of its unit and without using an air quality monitor by analyzing provided sample data.
This course in crystal structure refinement examines the practical aspects of crystal …
This course in crystal structure refinement examines the practical aspects of crystal structure determination from data collection strategies to data reduction and basic and advanced refinement problems of organic and inorganic molecules.
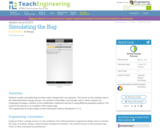
Student teams design and create LEGO® structures to house and protect temperature …
Student teams design and create LEGO® structures to house and protect temperature sensors. They leave their structures in undisturbed locations for a week, and regularly check and chart the temperatures. This activity engages students in the design and analysis aspects of engineering.
Geographic information systems (GIS), once used predominantly by experts in cartography and …
Geographic information systems (GIS), once used predominantly by experts in cartography and computer programming, have become pervasive in everyday business and consumer use. This unit explores GIS in general as a technology about which much more can be learned, and it also explores applications of that technology. Students experience GIS technology through the use of Google Earth on the environmental topic of plastics in the ocean in an area known as the Great Pacific Garbage Patch. The use of this topic in GIS makes the unit multidisciplinary, incorporating the physics of ocean currents, the chemistry associated with pollutant degradation and chemical sorption to organic-rich plastics, and ecological impact to aquatic biota.
This video lesson is part of a two-part series and introduces the …
This video lesson is part of a two-part series and introduces the concept of temperature. Temperature can be a challenging concept to convey since our perception is tied to words that are relative to our own experience, which varies quite a lot. A short activity to be performed in the classroom shows the need for a temperature scale since qualitative descriptions are not adequate. Temperatures that vary from the hottest to coldest recorded temperatures on earth are shown in advance of introducing the boiling temperatures of a number of cryogenic liquids.
Students learn about video motion capture technology, becoming familiar with concepts such …
Students learn about video motion capture technology, becoming familiar with concepts such as vector components, magnitudes and directions, position, velocity, and acceleration. They use a (free) classroom data collection and processing tool—the ARK Mirror—to visualize and record 3-D motion. The Augmented Reality Kinematics (ARK) Mirror software collects data via a motion detector. Using an Orbbec Astra Pro 3D camera or Microsoft Kinect (see note below), students can visualize and record a robust set of data and interpret them using statistical and graphical methods. This lesson introduces students to just one possible application of the ARK Mirror software—in the context of a high school physics class. Note: The ARK Mirror is ported to operate on an Orbbec platform. It may also be used with a Microsoft Kinect, although that Microsoft hardware has been discontinued. Refer to the Using ARK Mirror and Microsoft Kinect attachment for how to use the ARK MIrror software with Microsoft Kinect.
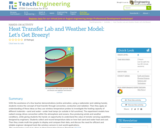
With the assistance of a few teacher demonstrations (online animation, using a …
With the assistance of a few teacher demonstrations (online animation, using a radiometer and rubbing hands), students review the concept of heat transfer through convection, conduction and radiation. Then they apply an understanding of these ideas as they use wireless temperature probes to investigate the heating capacity of different materials sand and water under heat lamps (or outside in full sunshine). The experiment models how radiant energy drives convection within the atmosphere and oceans, thus producing winds and weather conditions, while giving students the hands-on opportunity to understand the value of remote-sensing capabilities designed by engineers. Students collect and record temperature data on how fast sand and water heat and cool. Then they create multi-line graphs to display and compare their data, and discuss the need for efficient and reliable engineer-designed tools like wireless sensors in real-world applications.
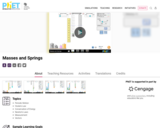
A realistic mass and spring laboratory. Hang masses from springs and adjust …
A realistic mass and spring laboratory. Hang masses from springs and adjust the spring stiffness and damping. You can even slow time. Transport the lab to different planets. A chart shows the kinetic, potential, and thermal energy for each spring.
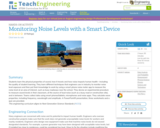
Students learn the physical properties of sound, how it travels and how …
Students learn the physical properties of sound, how it travels and how noise impacts human health—including the quality of student learning. They learn different techniques that engineers use in industry to monitor noise level exposure and then put their knowledge to work by using a smart phone noise meter app to measure the noise level at an area of interest, such as busy roadways near the school. They devise an experimental procedure to measure sound levels in their classroom, at the source of loud noise (such as a busy road or construction site), and in between. Teams collect data using smart phones/tablets, microphones and noise apps. They calculate wave properties, including frequency, wavelength and amplitude. A PowerPoint® presentation, three worksheets and a quiz are provided.
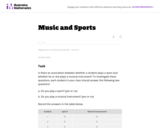
In this group task students collect data and analyze from the class …
In this group task students collect data and analyze from the class to answer the question "is there an association between whether a student plays a sport and whether he or she plays a musical instrument? "
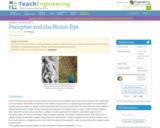
Vision is the primary sense of many animals and much is known …
Vision is the primary sense of many animals and much is known about how vision is processed in the mammalian nervous system. One distinct property of the primary visual cortex is a highly organized pattern of sensitivity to location and orientation of objects in the visual field. But how did we learn this? An important tool is the ability to design experiments to map out the structure and response of a system such as vision. In this activity, students learn about the visual system and then conduct a model experiment to map the visual field response of a Panoptes robot. (In Greek mythology, Argus Panoptes was the "all-seeing" watchman giant with 100 eyes.) A simple activity modification enables a true black box experiment, in which students do not directly observe how the visual system is configured, and must match the input to the output in order to reconstruct the unseen system inside the box.
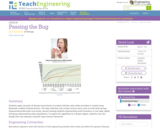
Students apply concepts of disease transmission to analyze infection data, either provided …
Students apply concepts of disease transmission to analyze infection data, either provided or created using Bluetooth-enabled Android devices. This data collection may include several cases, such as small static groups (representing historically rural areas), several roaming students (representing world-travelers), or one large, tightly knit group (representing urban populations). To explore the algorithms to a deeper degree, students may also design their own diseases using the App Inventor framework.
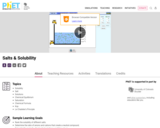
Add different salts to water, then watch them dissolve and achieve a …
Add different salts to water, then watch them dissolve and achieve a dynamic equilibrium with solid precipitate. Compare the number of ions in solution for highly soluble NaCl to other slightly soluble salts. Relate the charges on ions to the number of ions in the formula of a salt. Calculate Ksp values.
Students modify a provided App Inventor code to design their own diseases. …
Students modify a provided App Inventor code to design their own diseases. This serves as the evolution step in the software/systems design process. The activity is essentially a mini design cycle in which students are challenged to design a solution to the modification, implement and test it using different population patterns The result of this process is an evolution of the original app.
Introduces students to basic properties of structural materials and behavior of simple …
Introduces students to basic properties of structural materials and behavior of simple structural elements and systems through a series of experiments. Students learn experimental technique, data collection, reduction and analysis, and presentation of results.
No restrictions on your remixing, redistributing, or making derivative works. Give credit to the author, as required.
Your remixing, redistributing, or making derivatives works comes with some restrictions, including how it is shared.
Your redistributing comes with some restrictions. Do not remix or make derivative works.
Most restrictive license type. Prohibits most uses, sharing, and any changes.
Copyrighted materials, available under Fair Use and the TEACH Act for US-based educators, or other custom arrangements. Go to the resource provider to see their individual restrictions.