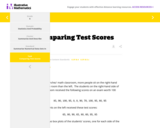
This is a task from the Illustrative Mathematics website that is one …
This is a task from the Illustrative Mathematics website that is one part of a complete illustration of the standard to which it is aligned. Each task has at least one solution and some commentary that addresses important aspects of the task and its potential use.
This textbook is part of the OpenIntro Statistics series and offers complete …
This textbook is part of the OpenIntro Statistics series and offers complete coverage of the high school AP Statistics curriculum. Real data and plenty of inline examples and exercises make this an engaging and readable book. Links to lecture slides, video overviews, calculator tutorials, and video solutions to selected end of chapter exercises make this an ideal choice for any high school or Community College teacher. In fact, Portland Community College recently adopted this textbook for its Introductory Statistics course, and it estimates that this will save their students $250,000 per year. Find out more at: openintro.org/ahss
View our video tutorials here: openintro.org/casio openintro.org/TI
In this module, students reconnect with and deepen their understanding of statistics …
In this module, students reconnect with and deepen their understanding of statistics and probability concepts first introduced in Grades 6, 7, and 8. Students develop a set of tools for understanding and interpreting variability in data, and begin to make more informed decisions from data. They work with data distributions of various shapes, centers, and spreads. Students build on their experience with bivariate quantitative data from Grade 8. This module sets the stage for more extensive work with sampling and inference in later grades.
**NOTE: The New York State Education Department shut down the EngageNY website in 2022. In order to maintain educators' access, nearly all resources have been uploaded to archive.org and the resource links above have been updated to reflect their new locations.**
This is a "first course" in the sense that it presumes no …
This is a "first course" in the sense that it presumes no previous course in probability. The units are modules taken from the unpublished text: Paul E. Pfeiffer, ELEMENTS OF APPLIED PROBABILITY, USING MATLAB. The units are numbered as they appear in the text, although of course they may be used in any desired order. For those who wish to use the order of the text, an outline is provided, with indication of which modules contain the material.
Measuring the dimensions of nano-circuits requires an expensive, high-resolution microscope with integrated …
Measuring the dimensions of nano-circuits requires an expensive, high-resolution microscope with integrated video camera and a computer with sophisticated imaging software, but in this activity, students measure nano-circuits using a typical classroom computer and (the free-to-download) GeoGebra geometry software. Inserting (provided) circuit pictures from a high-resolution microscope as backgrounds in GeoGebra's graphing window, students use the application's tools to measure lengths and widths of circuit elements. To simplify the conversion from the on-screen units to the real circuits' units and the manipulation of the pictures, a GeoGebra measuring interface is provided. Students export their data from GeoGebra to Microsoft® Excel® for graphing and analysis. They test the statistical significance of the difference in circuit dimensions, as well as obtain a correlation between average changes in original vs. printed circuits' widths. This activity and its associated lesson are suitable for use during the last six weeks of the AP Statistics course; see the topics and timing note below for details.
This learning video deals with a question of geometrical probability. A key …
This learning video deals with a question of geometrical probability. A key idea presented is the fact that a linear equation in three dimensions produces a plane. The video focuses on random triangles that are defined by their three respective angles. These angles are chosen randomly subject to a constraint that they must sum to 180 degrees. An example of the types of in-class activities for between segments of the video is: Ask six students for numbers and make those numbers the coordinates x,y of three points. Then have the class try to figure out how to decide if the triangle with those corners is acute or obtuse.
The Art of the Probable" addresses the history of scientific ideas, in …
The Art of the Probable" addresses the history of scientific ideas, in particular the emergence and development of mathematical probability. But it is neither meant to be a history of the exact sciences per se nor an annex to, say, the Course 6 curriculum in probability and statistics. Rather, our objective is to focus on the formal, thematic, and rhetorical features that imaginative literature shares with texts in the history of probability. These shared issues include (but are not limited to): the attempt to quantify or otherwise explain the presence of chance, risk, and contingency in everyday life; the deduction of causes for phenomena that are knowable only in their effects; and, above all, the question of what it means to think and act rationally in an uncertain world. Our course therefore aims to broaden students’ appreciation for and understanding of how literature interacts with--both reflecting upon and contributing to--the scientific understanding of the world. We are just as centrally committed to encouraging students to regard imaginative literature as a unique contribution to knowledge in its own right, and to see literary works of art as objects that demand and richly repay close critical analysis. It is our hope that the course will serve students well if they elect to pursue further work in Literature or other discipline in SHASS, and also enrich or complement their understanding of probability and statistics in other scientific and engineering subjects they elect to take.
Students act as R&D entrepreneurs, learning ways to research variables affecting the …
Students act as R&D entrepreneurs, learning ways to research variables affecting the market of their proposed (hypothetical) products. They learn how to obtain numeric data using a variety of Internet tools and resources, sort and analyze the data using Excel and other software, and discover patterns and relationships that influence and guide decisions related to launching their products. First, student pairs research and collect pertinent consumer data, importing the data into spreadsheets. Then they clean, organize, chart and analyze the data to inform their product production and marketing plans. They calculate related statistics and gain proficiency in obtaining and finding relationships between variables, which is important in the work of engineers as well as for general technical literacy and decision-making. They summarize their work by suggesting product launch strategies and reporting their findings and conclusions in class presentations. A finding data tips handout, project/presentation grading rubric and alternative self-guided activity worksheet are provided. This activity is ideal for a high school statistics class.
This course covers sensing and measurement for quantitative molecular/cell/tissue analysis, in terms …
This course covers sensing and measurement for quantitative molecular/cell/tissue analysis, in terms of genetic, biochemical, and biophysical properties. Methods include light and fluorescence microscopies; electro-mechanical probes such as atomic force microscopy, laser and magnetic traps, and MEMS devices; and the application of statistics, probability and noise analysis to experimental data.
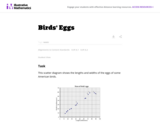
This task asks students to glean contextual information about bird eggs from …
This task asks students to glean contextual information about bird eggs from a collection of measurements of said eggs organized in a scatter plot. In particular, students are asked to identify a correlation and use it to make interpolative predictions, and reason about the properties of specific eggs via the graphical presentation of the data.
Describe a bivariate relationship's linearity, strength, and direction. In other words, plotting …
Describe a bivariate relationship's linearity, strength, and direction. In other words, plotting things that take two variables into consideration and trying to see whether there's a pattern with how they relate.
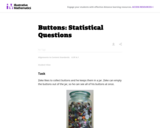
Statistics is the study of variability. Students who understand statistics need to …
Statistics is the study of variability. Students who understand statistics need to be able to identify and pose questions that can be answered by data that vary. The purpose of this task is to provide questions related to a particular context (a jar of buttons) so that students can identify which are statistical questions. The task also provides students with an opportunity to write a statistical question that pertains to the context.
No restrictions on your remixing, redistributing, or making derivative works. Give credit to the author, as required.
Your remixing, redistributing, or making derivatives works comes with some restrictions, including how it is shared.
Your redistributing comes with some restrictions. Do not remix or make derivative works.
Most restrictive license type. Prohibits most uses, sharing, and any changes.
Copyrighted materials, available under Fair Use and the TEACH Act for US-based educators, or other custom arrangements. Go to the resource provider to see their individual restrictions.