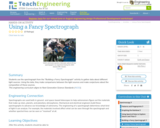
Students use the spectrograph from the "Building a Fancy Spectrograph" activity to …
Students use the spectrograph from the "Building a Fancy Spectrograph" activity to gather data about different light sources. Using the data, they make comparisons between the light sources and make conjectures about the composition of these sources.
For this task, Minitab software was used to generate 100 random samples …
For this task, Minitab software was used to generate 100 random samples of size 16 from a population where the probability of obtaining a success in one draw is 33.6% (Bernoulli). Given that multiple samples of the same size have been generated, students should note that there can be quite a bit of variability among the estimates from random samples and that on average, the center of the distribution of such estimates is at the actual population value and most of the estimates themselves tend to cluster around the actual population value.
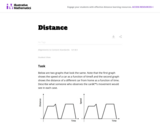
In this task students interpret two graphs that look the same but …
In this task students interpret two graphs that look the same but show very different quantities. The first graph gives information about how fast a car is moving while the second graph gives information about the position of the car. This problem works well to generate a class or small group discussion. Students learn that graphs tell stories and have to be interpreted by carefully thinking about the quantities shown.
This task could be used in instructional activities designed to build understandings …
This task could be used in instructional activities designed to build understandings of fraction division. With teacher guidance, it could be used to develop knowledge of the common denominator approach and the underlying rationale.
In this design challenge, students learn about the Vikings from an engineering …
In this design challenge, students learn about the Vikings from an engineering point-of-view. While investigating the history and anatomy of Viking ships, they learn how engineering solutions are shaped by the surrounding environment and availability of resources. Students apply this knowledge to design, build and test their own model Viking ships.
In this lesson, the electromagnetic spectrum is explained and students learn that …
In this lesson, the electromagnetic spectrum is explained and students learn that visible light makes up only a portion of this wide spectrum. Students also learn that engineers use electromagnetic waves for many different applications.
Students learn the value of writing and art in science and engineering. …
Students learn the value of writing and art in science and engineering. They acquire vocabulary that is appropriate for explaining visual art and learn about visual design principles (contrast, alignment, repetition and proximity) and elements (lines, color, texture, shape, size, value and space) that are helpful when making visual aids. A PowerPoint(TM) presentation heightens students' awareness of the connection between art and engineering in order to improve the presentation of results, findings, concepts, information and prototype designs. Students also learn about the science and engineering research funding process that relies on effective proposal presentations, as well as some thermal conductivity / heat flow basics including the real-world example of a heat sink which prepares them for the associated activity in which they focus on creating diagrams to communicate their own collected experimental data.
Students make simple spectroscopes (prisms) to look at different light sources. The …
Students make simple spectroscopes (prisms) to look at different light sources. The spectroscopes allow students to see differing spectral distributions of different light sources. Students also shine a light source through different materials with varying properties and compare the differences.
This problem is the fifth in a series of seven about ratios. …
This problem is the fifth in a series of seven about ratios. In the first problem students define the simple ratios that exist among the three candidates. It opens an opportunity to introduce unit rates. The subsequent problems are more complex. In the second problem, students apply their understanding of ratios to combine two pools of voters to determine a new ratio. In the third problem, students apply a known ratio to a new, larger pool of voters to determine the number of votes that would be garnered.
This is the sixth problem in a series of seven that use …
This is the sixth problem in a series of seven that use the context of a classroom election. While it still deals with simple ratios and easily managed numbers, the mathematics surrounding the ratios are increasingly complex.
This is the last problem of seven in a series about ratios …
This is the last problem of seven in a series about ratios set in the context of a classroom election. Since the number of voters is not known, the problem is quite abstract and requires a deep understanding of ratios and their relationship to fractions.
This is the first and most basic problem in a series of …
This is the first and most basic problem in a series of seven problems, all set in the context of a classroom election. Every problem requires students to understand what ratios are and apply them in a context. The problems build in complexity and can be used to highlight the multiple ways that one can reason about a context involving ratios.
This is the second in a series of tasks that are set …
This is the second in a series of tasks that are set in the context of a classroom election. It requires students to understand what ratios are and apply them in a context. The simple version of this question just asked how many votes each gets. This has the extra step of asking for the difference between the votes.
This problem, the third in a series of tasks set in the …
This problem, the third in a series of tasks set in the context of a class election, is more than just a problem of computing the number of votes each person receives. In fact, that isnŐt enough information to solve the problem. One must know how many votes it takes to make one half of the total number of votes. Although the numbers are easy to work with, there are enough steps and enough things to keep track of to lift the problem above routine.
This is the fourth in a series of tasks about ratios set …
This is the fourth in a series of tasks about ratios set in the context of a classroom election. What makes this problem interesting is that the number of voters is not given. This information isnŐt necessary, but at first glance some students may believe it is.
In WAC and Second-Language Writers, the editors and contributors pursue the ambitious …
In WAC and Second-Language Writers, the editors and contributors pursue the ambitious goal of including within WAC theory, research, and practice the differing perspectives, educational experiences, and voices of second-language writers. The chapters within this collection not only report new research but also share a wealth of pedagogical, curricular, and programmatic practices relevant to second-language writers. Representing a range of institutional perspectives—including those of students and faculty at public universities, community colleges, liberal arts colleges, and English-language schools—and a diverse set of geographical and cultural contexts, the editors and contributors report on work taking place in the United States, Asia, Europe, and the Middle East.
No restrictions on your remixing, redistributing, or making derivative works. Give credit to the author, as required.
Your remixing, redistributing, or making derivatives works comes with some restrictions, including how it is shared.
Your redistributing comes with some restrictions. Do not remix or make derivative works.
Most restrictive license type. Prohibits most uses, sharing, and any changes.
Copyrighted materials, available under Fair Use and the TEACH Act for US-based educators, or other custom arrangements. Go to the resource provider to see their individual restrictions.