CSDE Model Curricula Quick Start GuideEquitable and Inclusive Curriculum The CSDE believes in …
CSDE Model Curricula Quick Start GuideEquitable and Inclusive Curriculum The CSDE believes in providing a set of conditions where learners are repositioned at the center of curricula planning and design. Curricula, from a culturally responsive perspective, require intentional planning for diversity, equity, and inclusion in the development of units and implementation of lessons. It is critical to develop a learning environment that is relevant to and reflective of students’ social, cultural, and linguistic experiences to effectively connect their culturally and community-based knowledge to the class. Begin by connecting what is known about students’ cognitive and interdisciplinary diversity to the learning of the unit. Opposed to starting instructional planning with gaps in students’ knowledge, plan from an asset-based perspective by starting from students’ strengths. In doing so, curricula’s implementation will be grounded in instruction that engages, motivates, and supports the intellectual capacity of all students.Course Description: In Grade 7, instructional time should focus on four critical areas: (1) developing understanding of and applying proportional relationships; (2) developing understanding of operations with rational numbers and working with expressions and linear equations; (3) solving problems involving scale drawings and informal geometric constructions, and working with two- and three-dimensional shapes to solve problems involving area, surface area, and volume; and (4) drawing inferences about populations based on samples. Upon completion of this course students will have the ability to Analyze proportional relationships and use them to solve real-world and mathematical problems. Apply and extend previous understandings of operations with fractions to add, subtract, multiply, and divide rational numbers. Use properties of operations to generate equivalent expressions. Solve real-life and mathematical problems using numerical and algebraic expressions and equations. Draw, construct and describe geometrical figures and describe the relationships between them. Solve real-life and mathematical problems involving angle measure, area, surface area, and volume. Use random sampling to draw inferences about a population. Draw informal comparative inferences about two populations. Investigate chance processes and develop, use, and evaluate probability models.Aligned Core Resources: It is critical that curriculum be implemented using high quality instructional materials to ensure all students meet Connecticut’s standards. Ensuring alignment of resources to the standards is critical for success. There are tools that are available to districts to assist in evaluating alignment of resources, such as CCSSO’s Mathematics Curriculum Analysis Project and Student Achievement Partner’s Instructional Materials Evaluation Tool. In addition, there exist compilations of completed reviews from a variety of resources. Some of these include but are not limited to EdReports, Louisiana Believes, CURATE, and Oregon Adopted Instructional Materials.Aligned Core Programs: The CSDE in partnership with SERC has engaged with providers of high-quality vetted resources to provide additional alignment guidance to the CSDE model curriculum. High-quality instructional resources are critical for improving student outcomes. The alignment guidance is intended to clarify content and support understanding for clear implementation and coherence. Materials selection is a local control decision and these documents have been provided from participating publishers to assist districts in implementation. Use of the materials from these publishers is not required. These aligned core programs meet expectations as reported by EdReports. If your resource is not listed below, you are encouraged to review EdReports to ensure the alignment of your resource to the Connecticut Core Standards. Strong alignment of curricula and instructional materials have the potential to support student engagement of meaningful grade level content daily and teacher growth. Carnegie Learning Math Grade 7EdGems Math Grade 7enVisions Grade 7Eureka Math Grade 7Fishtank Plus Math Grade 7HMH Into Math Grade 7Imagine Learning Illustrative Mathematics Grade 7i-Ready Math Grade 7MidSchoolMath Grade 7Open Up Resouces Math Grade 7Reveal Math Grade 7Additional Course Information: Major work of Grade 7 mathematics focuses on ratios and proportional relationships and arithmetic of rational numbers. Habits of Mind/SEIH/Transferable Skills Addressed in the Course: The Standards for Mathematical Practice describe the thinking processes, habits of mind, and dispositions that students need to develop a deep, flexible, and enduring understanding of mathematics. They describe student behaviors, ensure an understanding of math, and focus on developing reasoning and building mathematical communication. Therefore, the following should be addressed throughout the course: Make sense of problems & persevere in solving them Reason abstractly & quantitatively Construct viable arguments & critique the reasoning of others Model with mathematics Use appropriate tools strategically Attend to precision Look for & make use of structure Look for & express regularity in repeated reasoning
Unit Overview/Summary - FOCUS: This unit focuses on Statistics and Probability. Learning this …
Unit Overview/Summary - FOCUS: This unit focuses on Statistics and Probability. Learning this unit will enable students to: Use random sampling to draw inferences about a population. Draw informal comparative inferences about two populations.
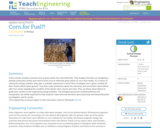
In this activity, students examine how to grow plants the most efficiently. …
In this activity, students examine how to grow plants the most efficiently. They imagine that they are designing a biofuels production facility and need to know how to efficiently grow plants to use in this facility. As a means of solving this design problem, they plan a scientific experiment in which they investigate how a given variable (of their choice) affects plant growth. They then make predictions about the outcomes and record their observations after two weeks regarding the condition of the plants' stem, leaves and roots. They use these observations to guide their solution to the engineering design problem. The biological processes of photosynthesis and transpiration are briefly explained to help students make informed decisions about planning and interpreting their investigation and its results.
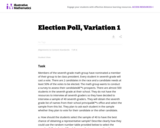
This task introduces the fundamental statistical ideas of using data summaries (statistics) …
This task introduces the fundamental statistical ideas of using data summaries (statistics) from random samples to draw inferences (reasoned conclusions) about population characteristics (parameters). In the task built around an election poll scenario, the population is the entire seventh grade class, the unknown characteristic (parameter) of interest is the proportion of the class members voting for a specific candidate, and the sample summary (statistic) is the observed proportion of voters favoring the candidate in a random sample of class members.
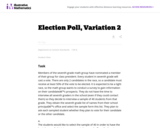
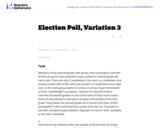
The task is designed to show that random samples produce distributions of …
The task is designed to show that random samples produce distributions of sample means that center at the population mean, and that the variation in the sample means will decrease noticeably as the sample size increases. Random sampling (like mixing names in a hat and drawing out a sample) is not a new idea to most students, although the terminology is likely to be new.
In this module, students begin their study of probability, learning how to …
In this module, students begin their study of probability, learning how to interpret probabilities and how to compute probabilities in simple settings. They also learn how to estimate probabilities empirically. Probability provides a foundation for the inferential reasoning developed in the second half of this module. Additionally, students build on their knowledge of data distributions that they studied in Grade 6, compare data distributions of two or more populations, and are introduced to the idea of drawing informal inferences based on data from random samples.
**NOTE: The New York State Education Department shut down the EngageNY website in 2022. In order to maintain educators' access, nearly all resources have been uploaded to archive.org and the resource links above have been updated to reflect their new locations.**
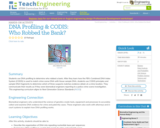
Students use DNA profiling to determine who robbed a bank. After they …
Students use DNA profiling to determine who robbed a bank. After they learn how the FBI's Combined DNA Index System (CODIS) is used to match crime scene DNA with tissue sample DNA, students use CODIS principles and sample DNA fragments to determine which of three suspects matches evidence obtain at a crime location. They communicate their results as if they were biomedical engineers reporting to a police crime scene investigation.
No restrictions on your remixing, redistributing, or making derivative works. Give credit to the author, as required.
Your remixing, redistributing, or making derivatives works comes with some restrictions, including how it is shared.
Your redistributing comes with some restrictions. Do not remix or make derivative works.
Most restrictive license type. Prohibits most uses, sharing, and any changes.
Copyrighted materials, available under Fair Use and the TEACH Act for US-based educators, or other custom arrangements. Go to the resource provider to see their individual restrictions.