Students experiment with various ways to naturally dye materials using sources found …
Students experiment with various ways to naturally dye materials using sources found in nature—roots, leaves, seeds, spices, etc.—as well as the method of extracting dyes. Then they analyze various materials using statistical methods and tackle an engineering design challenge—to find dyes that best suit the needs of a startup sustainable clothing company.
This task introduces the fundamental statistical ideas of using data summaries (statistics) …
This task introduces the fundamental statistical ideas of using data summaries (statistics) from random samples to draw inferences (reasoned conclusions) about population characteristics (parameters). In the task built around an election poll scenario, the population is the entire seventh grade class, the unknown characteristic (parameter) of interest is the proportion of the class members voting for a specific candidate, and the sample summary (statistic) is the observed proportion of voters favoring the candidate in a random sample of class members.
n addition to providing a task that relates to other disciplines (history, …
n addition to providing a task that relates to other disciplines (history, civics, current events, etc.), this task is intended to demonstrate that a graph can summarize a distribution as well as provide useful information about specific observations.
The task is designed to show that random samples produce distributions of …
The task is designed to show that random samples produce distributions of sample means that center at the population mean, and that the variation in the sample means will decrease noticeably as the sample size increases. Random sampling (like mixing names in a hat and drawing out a sample) is not a new idea to most students, although the terminology is likely to be new.
Students apply what they know about light polarization and attenuation (learned in …
Students apply what they know about light polarization and attenuation (learned in the associated lesson) to design, build, test, refine and then advertise their prototypes for more effective sunglasses. Presented as a hypothetical design scenario, students act as engineers who are challenged to create improved sunglasses that reduce glare and lower light intensity while increasing eye protection from UVA and UVB radiation compared to an existing model of sunglasses—and make them as inexpensive as possible. They use a light meter to measure and compare light intensities through the commercial sunglasses and their prototype lenses. They consider the project requirements and constraints in their designs. They brainstorm and evaluate possible design ideas. They keep track of materials costs. They create and present advertisements to the class that promote the sunglasses benefits, using collected data to justify their claims. A grading rubric and reflection handout are provided.
In this module, students move from simply representing data into analysis of …
In this module, students move from simply representing data into analysis of data. Students begin to think and reason statistically, first by recognizing a statistical question as one that can be answered by collecting data. Students learn that the data collected to answer a statistical question has a distribution that is often summarized in terms of center, variability, and shape. Throughout the module, students see and represent data distributions using dot plots and histograms. They study quantitative ways to summarize numerical data sets in relation to their context and to the shape of the distribution. As the module ends, students synthesize what they have learned as they connect the graphical, verbal, and numerical summaries to each other within situational contexts, culminating with a major project.
**NOTE: The New York State Education Department shut down the EngageNY website in 2022. In order to maintain educators' access, nearly all resources have been uploaded to archive.org and the resource links above have been updated to reflect their new locations.**
In this module, students begin their study of probability, learning how to …
In this module, students begin their study of probability, learning how to interpret probabilities and how to compute probabilities in simple settings. They also learn how to estimate probabilities empirically. Probability provides a foundation for the inferential reasoning developed in the second half of this module. Additionally, students build on their knowledge of data distributions that they studied in Grade 6, compare data distributions of two or more populations, and are introduced to the idea of drawing informal inferences based on data from random samples.
**NOTE: The New York State Education Department shut down the EngageNY website in 2022. In order to maintain educators' access, nearly all resources have been uploaded to archive.org and the resource links above have been updated to reflect their new locations.**
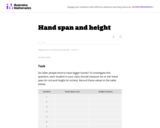
This task uses student generated data to assess standard 7.SP.7. This task …
This task uses student generated data to assess standard 7.SP.7. This task could also be extended to address Standard 7.SP.1 by adding a small or whole class discussion of whether the class could be considered as a representative sample of all students at your school.
This course is an introduction to data cleaning, analysis and visualization. We …
This course is an introduction to data cleaning, analysis and visualization. We will teach the basics of data analysis through concrete examples. You will learn how to take raw data, extract meaningful information, use statistical tools, and make visualizations. This was offered as a non-credit course during the Independent Activities Period (IAP), which is a special 4-week term at MIT that runs from the first week of January until the end of the month.
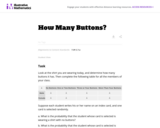
This is a task from the Illustrative Mathematics website that is one …
This is a task from the Illustrative Mathematics website that is one part of a complete illustration of the standard to which it is aligned. Each task has at least one solution and some commentary that addresses important aspects of the task and its potential use.
Much of statistics is based upon using data from a random sample …
Much of statistics is based upon using data from a random sample that is representative of the population at large. From that sample mean, we can infer things about the greater population mean. We'll explain.
Introduction to Financial Mathematics: Concepts and Computational Methods serves as a primer …
Introduction to Financial Mathematics: Concepts and Computational Methods serves as a primer in financial mathematics with a focus on conceptual understanding of models and problem solving. It includes the mathematical background needed for risk management, such as probability theory, optimization, and the like. The goal of the book is to expose the reader to a wide range of basic problems, some of which emphasize analytic ability, some requiring programming techniques and others focusing on statistical data analysis. In addition, it covers some areas which are outside the scope of mainstream financial mathematics textbooks. For example, it presents marginal account setting by the CCP and systemic risk, and a brief overview of the model risk. Inline exercises and examples are included to help students prepare for exams on this book.
Probability theory began in seventeenth century France when the two great French …
Probability theory began in seventeenth century France when the two great French mathematicians, Blaise Pascal and Pierre de Fermat, corresponded over two problems from games of chance. Problems like those Pascal and Fermat solved continued to influence such early researchers as Huygens, Bernoulli, and DeMoivre in establishing a mathematical theory of probability. Today, probability theory is a well established branch of mathematics that finds applications in every area of scholarly activity from music to physics, and in daily experience from weather prediction to predicting the risks of new medical treatments.
This text is designed for an introductory probability course taken by sophomores, juniors, and seniors in mathematics, the physical and social sciences, engineering, and computer science. It presents a thorough treatment of probability ideas and techniques necessary for a form understanding of the subject. The text can be used in a variety of course lengths, levels, and areas of emphasis.
For use in a standard one-term course, in which both discrete and continuous probability is covered, students should have taken as a prerequisite two terms of calculus, including an introduction to multiple integrals. In order to cover Chapter 11, which contains material on Markov chains, some knowledge of matrix theory is necessary.
We are constantly bombarded by information, and finding a way to filter …
We are constantly bombarded by information, and finding a way to filter that information in an objective way is crucial to surviving this onslaught with your sanity intact. This is what statistics, and logic we use in it, enables us to do. Through the lens of statistics, we learn to find the signal hidden in the noise when it is there and to know when an apparent trend or pattern is really just randomness. The study of statistics involves math and relies upon calculations of numbers. But it also relies heavily on how the numbers are chosen and how the statistics are interpreted.
This work was created as part of the University of Missouri’s Affordable and Open Access Educational Resources Initiative (https://www.umsystem.edu/ums/aa/oer). The contents of this work have been adapted from the following Open Access Resources: Online Statistics Education: A Multimedia Course of Study (http://onlinestatbook.com/). Project Leader: David M. Lane, Rice University. Changes to the original works were made by Dr. Garett C. Foster in the Department of Psychological Sciences to tailor the text to fit the needs of the introductory statistics course for psychology majors at the University of Missouri – St. Louis. Materials from the original sources have been combined, reorganized, and added to by the current author, and any conceptual, mathematical, or typographical errors are the responsibility of the current author.
No restrictions on your remixing, redistributing, or making derivative works. Give credit to the author, as required.
Your remixing, redistributing, or making derivatives works comes with some restrictions, including how it is shared.
Your redistributing comes with some restrictions. Do not remix or make derivative works.
Most restrictive license type. Prohibits most uses, sharing, and any changes.
Copyrighted materials, available under Fair Use and the TEACH Act for US-based educators, or other custom arrangements. Go to the resource provider to see their individual restrictions.