Interpretations of the concept of probability. Basic probability rules; random variables and …
Interpretations of the concept of probability. Basic probability rules; random variables and distribution functions; functions of random variables. Applications to quality control and the reliability assessment of mechanical/electrical components, as well as simple structures and redundant systems. Elements of statistics. Bayesian methods in engineering. Methods for reliability and risk assessment of complex systems, (event-tree and fault-tree analysis, common-cause failures, human reliability models). Uncertainty propagation in complex systems (Monte Carlo methods, Latin Hypercube Sampling). Introduction to Markov models. Examples and applications from nuclear and chemical-process plants, waste repositories, and mechanical systems. Open to qualified undergraduates.
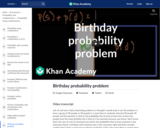
This lesson is a birthday problem that determines the probability that at …
This lesson is a birthday problem that determines the probability that at least 2 people in a room of 30 share the same birthday. [Probability playlist: Lesson 17 of 29]
This lesson demonstrates probability using combinations and shows the probability of getting …
This lesson demonstrates probability using combinations and shows the probability of getting exatly 3 heads in 8 flips of a fair coin. [Probability playlist: Lesson 14 of 29]
This lesson is another demonstration of probability and combinations to determine the …
This lesson is another demonstration of probability and combinations to determine the probability of making at least 3 out of 5 basketball free throws. [Probability playlist: Lesson 15 of 29]
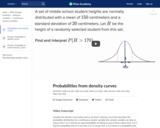
This course introduces students to probability and random variables. Topics include distribution …
This course introduces students to probability and random variables. Topics include distribution functions, binomial, geometric, hypergeometric, and Poisson distributions. The other topics covered are uniform, exponential, normal, gamma and beta distributions; conditional probability; Bayes theorem; joint distributions; Chebyshev inequality; law of large numbers; and central limit theorem.
Quantitative analysis of uncertainty and risk for engineering applications. Fundamentals of probability, …
Quantitative analysis of uncertainty and risk for engineering applications. Fundamentals of probability, random processes, statistics, and decision analysis. Random variables and vectors, uncertainty propagation, conditional distributions, and second-moment analysis. Introduction to system reliability. Bayesian analysis and risk-based decision. Estimation of distribution parameters, hypothesis testing, and simple and multiple linear regressions. Poisson and Markov processes. Emphasis on application to engineering problems.
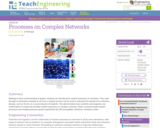
Building on their understanding of graphs, students are introduced to random processes …
Building on their understanding of graphs, students are introduced to random processes on networks. They walk through an illustrative example to see how a random process can be used to represent the spread of an infectious disease, such as the flu, on a social network of students. This demonstrates how scientists and engineers use mathematics to model and simulate random processes on complex networks. Topics covered include random processes and modeling disease spread, specifically the SIR (susceptible, infectious, resistant) model.
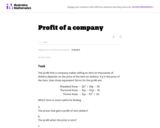
This task compares the usefulness of different forms of a quadratic expression. …
This task compares the usefulness of different forms of a quadratic expression. Students have to choose which form most easily provides information about the maximum value, the zeros and the vertical intercept of a quadratic expression in the context of a real world situation. Rather than just manipulating one form into the other, students can make sense out of the structure of the expressions.
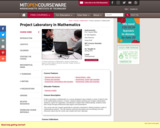
What's it like to do mathematical research? The "Project Laboratory in Mathematics" …
What's it like to do mathematical research? The "Project Laboratory in Mathematics" course from MIT's OpenCourseWare provides some fine insights into this endeavor. The course was originally developed by Professor Haynes Miller and features information about how to help students "explore puzzling and complex mathematical situations." The site includes selected video lectures from the course, instructor insights, and a selection of projects and examples, such as "The Dynamics of Successive Differences Over Z and R." Also, the site includes information on how to customize this course for a variety of settings, along with examples of classroom activities and helpful resources.
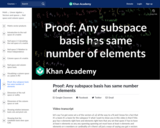
This free undergraduate textbook provides an introduction to proofs, logic, sets, functions, …
This free undergraduate textbook provides an introduction to proofs, logic, sets, functions, and other fundamental topics of abstract mathematics. It is designed to be the textbook for a bridge course that introduces undergraduates to abstract mathematics, but it is also suitable for independent study by undergraduates (or mathematically mature high-school students), or for use as a very inexpensive supplement to undergraduate courses in any field of abstract mathematics.
The book is being released online with a Creative Commons license (Attribution-NonCommercial-ShareAlike 2.0). Although not in final form, it has already been used as a textbook for several semesters at the University of Lethbridge, and has seen occasional use at other universities.
Students learn how biomedical engineers work with engineers and other professionals to …
Students learn how biomedical engineers work with engineers and other professionals to develop dependable medical devices. Specifically, they learn about suction pumps, which are important devices to keep in good repair, especially when they are used in remote locations. Student teams brainstorm, sketch, design and create prototypes of suction pump protection devices to keep fluid from backing up and ruining the pump motors. Using a real suction pump, they conduct repeated trials to test their devices for reliability, making improvements as necessary.
No restrictions on your remixing, redistributing, or making derivative works. Give credit to the author, as required.
Your remixing, redistributing, or making derivatives works comes with some restrictions, including how it is shared.
Your redistributing comes with some restrictions. Do not remix or make derivative works.
Most restrictive license type. Prohibits most uses, sharing, and any changes.
Copyrighted materials, available under Fair Use and the TEACH Act for US-based educators, or other custom arrangements. Go to the resource provider to see their individual restrictions.