In order to promote students’ conceptual understanding and learning experience in introductory …
In order to promote students’ conceptual understanding and learning experience in introductory statistics, a technology task, which focuses on the probability distribution in which means are defined, was created using TinkerPlots, an exploratory data analysis and modeling software. The targeted audiences range from senior high school grade levels to college freshmen who are starting their introductory course in statistics. Students will be guided to explore and discover the movement behaviors of means of a set of numbers randomly generated from a fixed range of values characterized by a predetermined probability distribution. The cognitive, mathematical, technological and pedagogical natures of the task, as well as its association with the statistics education framework based on the Guidelines for Assessment and Instruction in Statistics Education (GAISE) by the American Statistical Association, will be elaborated. A brief discussion on what cognitive design principles this task satisfies will also be provided at the end.
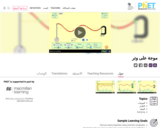
Investigate how torque causes an object to rotate. Discover the relationships between …
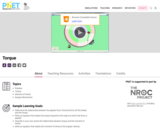
Investigate how torque causes an object to rotate. Discover the relationships between angular acceleration, moment of inertia, angular momentum and torque.
Investigate how torque causes an object to rotate. Discover the relationships between …
Investigate how torque causes an object to rotate. Discover the relationships between angular acceleration, moment of inertia, angular momentum and torque.
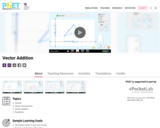
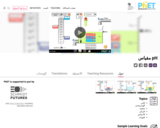
Learn how to add vectors. Drag vectors onto a graph, change their …
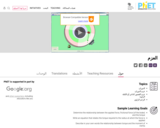
Learn how to add vectors. Drag vectors onto a graph, change their length and angle, and sum them together. The magnitude, angle, and components of each vector can be displayed in several formats.
Learn how to add vectors. Drag vectors onto a graph, change their …
Learn how to add vectors. Drag vectors onto a graph, change their length and angle, and sum them together. The magnitude, angle, and components of each vector can be displayed in several formats.
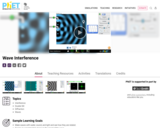
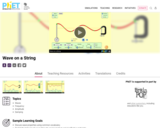
Watch a string vibrate in slow motion. Wiggle the end of the …
Watch a string vibrate in slow motion. Wiggle the end of the string and make waves, or adjust the frequency and amplitude of an oscillator. Adjust the damping and tension. The end can be fixed, loose, or open.
Watch a string vibrate in slow motion. Wiggle the end of the …
Watch a string vibrate in slow motion. Wiggle the end of the string and make waves, or adjust the frequency and amplitude of an oscillator. Adjust the damping and tension. The end can be fixed, loose, or open.
This computer-based learning module engages students in questions that scientists around the …
This computer-based learning module engages students in questions that scientists around the world are exploring about Earths climate. They gain an appreciation for how much is not known about the Earth and climate change. The module contains 5 activities; 1) Earths Changing Climates, 2) Interactions Within the Atmosphere, 3) Sources, Sinks, and Feedbacks, 4) Feedbacks of Ice and Clouds, and 5) Using Models to Make Predictions. Each activity provides information in simulations, text, video, or graphic format and the students enter answers to both open-ended and closed questions within the program. Once the students have completed an activity, they can print a report showing all the questions and their answers. The authors estimate the entire module should take 225 minutes.
When is an extremely simple personal calendar program, aimed at the Unix …
When is an extremely simple personal calendar program, aimed at the Unix geek who wants something minimalistic. It can keep track of things you need to do on particular dates.
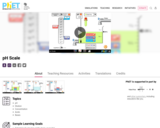
Test the pH of things like coffee, spit, and soap to determine …
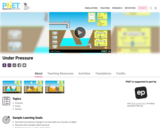
Test the pH of things like coffee, spit, and soap to determine whether each is acidic, basic, or neutral. Visualize the relative number of hydroxide ions and hydronium ions in solution. Switch between logarithmic and linear scales. Investigate whether changing the volume or diluting with water affects the pH. Or you can design your own liquid!
Test the pH of things like coffee, spit, and soap to determine …
Test the pH of things like coffee, spit, and soap to determine whether each is acidic, basic, or neutral. Visualize the relative number of hydroxide ions and hydronium ions in solution. Switch between logarithmic and linear scales. Investigate whether changing the volume or diluting with water affects the pH. Or you can design your own liquid!
No restrictions on your remixing, redistributing, or making derivative works. Give credit to the author, as required.
Your remixing, redistributing, or making derivatives works comes with some restrictions, including how it is shared.
Your redistributing comes with some restrictions. Do not remix or make derivative works.
Most restrictive license type. Prohibits most uses, sharing, and any changes.
Copyrighted materials, available under Fair Use and the TEACH Act for US-based educators, or other custom arrangements. Go to the resource provider to see their individual restrictions.