In this module, students reconnect with and deepen their understanding of statistics …
In this module, students reconnect with and deepen their understanding of statistics and probability concepts first introduced in Grades 6, 7, and 8. Students develop a set of tools for understanding and interpreting variability in data, and begin to make more informed decisions from data. They work with data distributions of various shapes, centers, and spreads. Students build on their experience with bivariate quantitative data from Grade 8. This module sets the stage for more extensive work with sampling and inference in later grades.
**NOTE: The New York State Education Department shut down the EngageNY website in 2022. In order to maintain educators' access, nearly all resources have been uploaded to archive.org and the resource links above have been updated to reflect their new locations.**
Students learn a simple technique for quantifying the amount of photosynthesis that …
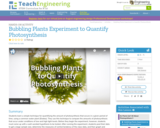
Students learn a simple technique for quantifying the amount of photosynthesis that occurs in a given period of time, using a common water plant (Elodea). They can use this technique to compare the amounts of photosynthesis that occur under conditions of low and high light levels. Before they begin the experiment, however, students must come up with a well-worded hypothesis to be tested. After running the experiment, students pool their data to get a large sample size, determine the measures of central tendency of the class data, and then graph and interpret the results.
Students use U.S. Geological Survey (USGS) real-time, real-world seismic data from around …
Students use U.S. Geological Survey (USGS) real-time, real-world seismic data from around the planet to identify where earthquakes occur and look for trends in earthquake activity. They explore where and why earthquakes occur, learning about faults and how they influence earthquakes. Looking at the interactive maps and the data, students use Microsoft® Excel® to conduct detailed analysis of the most-recent 25 earthquakes; they calculate mean, median, mode of the data set, as well as identify the minimum and maximum magnitudes. Students compare their predictions with the physical data, and look for trends to and patterns in the data. A worksheet serves as a student guide for the activity.
Students visit second- and fourth-grade classes to measure the heights of older …
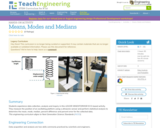
Students visit second- and fourth-grade classes to measure the heights of older students using large building blocks as a non-standard unit of measure. They also measure adults in the school community. Results are displayed in age-appropriate bar graphs (paper cut-outs of miniature building blocks glued on paper to form bar graphs) enabling a comparison of the heights of different age groups. The activities that comprise this activity help students develop the concepts and vocabulary to describe, in a non-ambiguous way, how heights change as children age. This introduction to graphing provides an important foundation for creating and interpreting graphs in future years.
Students experience data collection, analysis and inquiry in this LEGO® MINDSTORMS® NXT …
Students experience data collection, analysis and inquiry in this LEGO® MINDSTORMS® NXT -based activity. They measure the position of an oscillating platform using a ultrasonic sensor and perform statistical analysis to determine the mean, mode, median, percent difference and percent error for the collected data.
Principles of Macroeconomics 2e covers the scope and sequence of most introductory …
Principles of Macroeconomics 2e covers the scope and sequence of most introductory economics courses. The text includes many current examples, which are handled in a politically equitable way. The outcome is a balanced approach to the theory and application of economics concepts. The second edition has been thoroughly revised to increase clarity, update data and current event impacts, and incorporate the feedback from many reviewers and adopters.Changes made in Principles of Macroeconomics 2e are described in the preface and the transition guide to help instructors transition to the second edition.
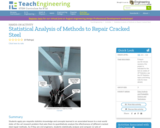
Students apply pre-requisite statistics knowledge and concepts learned in an associated lesson …
Students apply pre-requisite statistics knowledge and concepts learned in an associated lesson to a real-world state-of-the-art research problem that asks them to quantitatively analyze the effectiveness of different cracked steel repair methods. As if they are civil engineers, students statistically analyze and compare 12 sets of experimental data from seven research centers around the world using measurements of central tendency, five-number summaries, box-and-whisker plots and bar graphs. The data consists of the results from carbon-fiber-reinforced polymer patched and unpatched cracked steel specimens tested under the same stress conditions. Based on their findings, students determine the most effective cracked steel repair method, create a report, and present their results, conclusions and recommended methods to the class as if they were presenting to the mayor and city council. This activity and its associated lesson are suitable for use during the last six weeks of the AP Statistics course; see the topics and timing note for details.
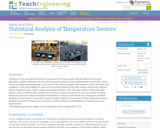
Working as if they are engineers aiming to analyze and then improve …
Working as if they are engineers aiming to analyze and then improve data collection devices for precision agriculture, students determine how accurate temperature sensors are by comparing them to each other. Teams record soil temperature data during a class period while making changes to the samples to mimic real-world crop conditions—such as the addition of water and heat and the removal of the heat. Groups analyze their collected data by finding the mean, median, mode, and standard deviation. Then, the class combines all the team data points in order to compare data collected from numerous devices and analyze the accuracy of their recording devices by finding the standard deviation of temperature readings at each minute. By averaging the standard deviations of each minute’s temperature reading, students determine the accuracy of their temperature sensors. Students present their findings and conclusions, including making recommendations for temperature sensor improvements.
Students collect a large set of data (approximately 60 sets) of individual …
Students collect a large set of data (approximately 60 sets) of individual student’s water use and learn how to use spreadsheets to graph the data and find mean, median, mode, and range. They compared their findings to the national average of water use per person per day and use it to evaluate how much water a municipality would need in the event of a recovery from a water shutdown. This analysis activity introduces students to the concept of central tendencies and how to use spreadsheets to find them.
No restrictions on your remixing, redistributing, or making derivative works. Give credit to the author, as required.
Your remixing, redistributing, or making derivatives works comes with some restrictions, including how it is shared.
Your redistributing comes with some restrictions. Do not remix or make derivative works.
Most restrictive license type. Prohibits most uses, sharing, and any changes.
Copyrighted materials, available under Fair Use and the TEACH Act for US-based educators, or other custom arrangements. Go to the resource provider to see their individual restrictions.