Students act as R&D entrepreneurs, learning ways to research variables affecting the …
Students act as R&D entrepreneurs, learning ways to research variables affecting the market of their proposed (hypothetical) products. They learn how to obtain numeric data using a variety of Internet tools and resources, sort and analyze the data using Excel and other software, and discover patterns and relationships that influence and guide decisions related to launching their products. First, student pairs research and collect pertinent consumer data, importing the data into spreadsheets. Then they clean, organize, chart and analyze the data to inform their product production and marketing plans. They calculate related statistics and gain proficiency in obtaining and finding relationships between variables, which is important in the work of engineers as well as for general technical literacy and decision-making. They summarize their work by suggesting product launch strategies and reporting their findings and conclusions in class presentations. A finding data tips handout, project/presentation grading rubric and alternative self-guided activity worksheet are provided. This activity is ideal for a high school statistics class.
With your mouse, drag data points and their error bars, and watch …
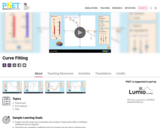
With your mouse, drag data points and their error bars, and watch the best-fit polynomial curve update instantly. You choose the type of fit: linear, quadratic, cubic, or quartic. The reduced chi-square statistic shows you when the fit is good. Or you can try to find the best fit by manually adjusting fit parameters.
This course gives a mathematical introduction to neural coding and dynamics. Topics …
This course gives a mathematical introduction to neural coding and dynamics. Topics include convolution, correlation, linear systems, game theory, signal detection theory, probability theory, information theory, and reinforcement learning. Applications to neural coding, focusing on the visual system are covered, as well as, Hodgkin-Huxley and other related models of neural excitability, stochastic models of ion channels, cable theory, and models of synaptic transmission. Visit the Seung Lab Web site.
Introduction to Sociology 2e adheres to the scope and sequence of a …
Introduction to Sociology 2e adheres to the scope and sequence of a typical, one-semester introductory sociology course. It offers comprehensive coverage of core concepts, foundational scholars, and emerging theories, which are supported by a wealth of engaging learning materials. The textbook presents detailed section reviews with rich questions, discussions that help students apply their knowledge, and features that draw learners into the discipline in meaningful ways. The second edition retains the book’s conceptual organization, aligning to most courses, and has been significantly updated to reflect the latest research and provide examples most relevant to today’s students. In order to help instructors transition to the revised version, the 2e changes are described within the preface.
Differentiate between four kinds of research methods: surveys, field research, experiments, and …
Differentiate between four kinds of research methods: surveys, field research, experiments, and secondary data analysisUnderstand why different topics are better suited to different research approaches
You are probably asking yourself the question, "When and where will I …
You are probably asking yourself the question, "When and where will I use statistics?". If you read any newspaper or watch television, or use the Internet, you will see statistical information. There are statistics about crime, sports, education, politics, and real estate. Typically, when you read a newspaper article or watch a news program on television, you are given sample information. With this information, you may make a decision about the correctness of a statement, claim, or "fact." Statistical methods can help you make the "best educated guess."
Psychology is designed to meet scope and sequence requirements for the single-semester …
Psychology is designed to meet scope and sequence requirements for the single-semester introduction to psychology course. The book offers a comprehensive treatment of core concepts, grounded in both classic studies and current and emerging research. The text also includes coverage of the DSM-5 in examinations of psychological disorders. Psychology incorporates discussions that reflect the diversity within the discipline, as well as the diversity of cultures and communities across the globe.Senior Contributing AuthorsRose M. Spielman, Formerly of Quinnipiac UniversityContributing AuthorsKathryn Dumper, Bainbridge State CollegeWilliam Jenkins, Mercer UniversityArlene Lacombe, Saint Joseph's UniversityMarilyn Lovett, Livingstone CollegeMarion Perlmutter, University of Michigan
By the end of this section, you will be able to:Explain what …
By the end of this section, you will be able to:Explain what a correlation coefficient tells us about the relationship between variablesRecognize that correlation does not indicate a cause-and-effect relationship between variablesDiscuss our tendency to look for relationships between variables that do not really existExplain random sampling and assignment of participants into experimental and control groupsDiscuss how experimenter or participant bias could affect the results of an experimentIdentify independent and dependent variables
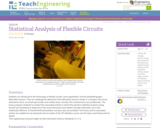
Students are introduced to the technology of flexible circuits, some applications and …
Students are introduced to the technology of flexible circuits, some applications and the photolithography fabrication process. They are challenged to determine if the fabrication process results in a change in the circuit dimensions since, as circuits get smaller and smaller (nano-circuits), this could become very problematic. The lesson prepares students to conduct the associated activity in which they perform statistical analysis (using Excel® and GeoGebra) to determine if the circuit dimension sizes before and after fabrication are in fact statistically different. A PowerPoint® presentation and post-quiz are provided. This lesson and its associated activity are suitable for use during the last six weeks of the AP Statistics course; see the topics and timing note for details.
This course is a broad treatment of statistics, concentrating on specific statistical …
This course is a broad treatment of statistics, concentrating on specific statistical techniques used in science and industry. Topics include: hypothesis testing and estimation, confidence intervals, chi-square tests, nonparametric statistics, analysis of variance, regression, correlation, decision theory, and Bayesian statistics.
No restrictions on your remixing, redistributing, or making derivative works. Give credit to the author, as required.
Your remixing, redistributing, or making derivatives works comes with some restrictions, including how it is shared.
Your redistributing comes with some restrictions. Do not remix or make derivative works.
Most restrictive license type. Prohibits most uses, sharing, and any changes.
Copyrighted materials, available under Fair Use and the TEACH Act for US-based educators, or other custom arrangements. Go to the resource provider to see their individual restrictions.