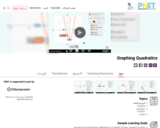
Learn about graphing polynomials. The shape of the curve changes as the …
Learn about graphing polynomials. The shape of the curve changes as the constants are adjusted. View the curves for the individual terms (e.g. y=bx ) to see how they add to generate the polynomial curve.
Build a gene network! The lac operon is a set of genes …
Build a gene network! The lac operon is a set of genes which are responsible for the metabolism of lactose in some bacterial cells. Explore the effects of mutations within the lac operon by adding or removing genes from the DNA.
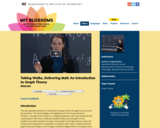
This learning video presents an introduction to graph theory through two fun, …
This learning video presents an introduction to graph theory through two fun, puzzle-like problems: ''The Seven Bridges of Konigsberg'' and ''The Chinese Postman Problem''. Any high school student in a college-preparatory math class should be able to participate in this lesson. Materials needed include: pen and paper for the students; if possible, printed-out copies of the graphs and image that are used in the module; and a blackboard or equivalent. During this video lesson, students will learn graph theory by finding a route through a city/town/village without crossing the same path twice. They will also learn to determine the length of the shortest route that covers all the roads in a city/town/village. To achieve these two learning objectives, they will use nodes and arcs to create a graph and represent a real problem.
In this lesson, students will list the steps of drawing a graph …
In this lesson, students will list the steps of drawing a graph and determine whether a line or bar graph should be used based on the data. They will demonstrate understanding by graphing sample data and construct, interpret, and analyze a graph from data collected.
No restrictions on your remixing, redistributing, or making derivative works. Give credit to the author, as required.
Your remixing, redistributing, or making derivatives works comes with some restrictions, including how it is shared.
Your redistributing comes with some restrictions. Do not remix or make derivative works.
Most restrictive license type. Prohibits most uses, sharing, and any changes.
Copyrighted materials, available under Fair Use and the TEACH Act for US-based educators, or other custom arrangements. Go to the resource provider to see their individual restrictions.