In this lesson, students will distinguish between experimental and literary research and …
In this lesson, students will distinguish between experimental and literary research and sort sources to determine the relevance and validity of scientific information to a given problem. They will also identify and explain the relevance of parts of an article to the given problem.
In this lesson, student will be able to create a class rubric …
In this lesson, student will be able to create a class rubric for evaluating timeliness, relevance, reliability, biasness, and validity of online articles to a given problem. They will also utilize online tools to evaluate scientific information for relevance to a given problem.
In this lesson, students will sort through online articles to determine which …
In this lesson, students will sort through online articles to determine which address the given problem and use an online tool to evaluate online scientific information for relevance to a given problem.
In this lesson, students will use an online tool to evaluate online …
In this lesson, students will use an online tool to evaluate online scientific information for relevance to agiven problem and debate a claim supported through evaluating online scientific information for relevance to a given problem.
In this lesson, students will list the steps of drawing a graph …
In this lesson, students will list the steps of drawing a graph and determine whether a line or bar graph should be used based on the data. They will demonstrate understanding by graphing sample data and construct, interpret, and analyze a graph from data collected.
In this lesson, students define and explain and demonstrate an understanding of …
In this lesson, students define and explain and demonstrate an understanding of the hypothesis and null hypothesis. Then they apply knowledge of hypotheses to develop a hypothesis for a given question.
In this lesson, students will set up and maintain a legal scientific …
In this lesson, students will set up and maintain a legal scientific lab notebook and list the parts in order of a lab report that will be written within a legal scientific lab notebook. They will identify all necessary components of a graph needed for a legal scientific lab notebook and explain the importance of a legalscientific lab notebook.
In this lesson, students demonstrate appropriate observational skills, compose questions relating form …
In this lesson, students demonstrate appropriate observational skills, compose questions relating form to function, assess how each question could be tested, identify tractable questions when performing experiments, and frame testable questions showing evidence of observation and connections to prior knowledge.
In this lesson, students distinguish between controls and variables and work to …
In this lesson, students distinguish between controls and variables and work to define them. They explain, using the hypotheses examples, where the dependent and independent variables are in each example as well as define positive and negative controls. They also test hypotheses utilizing appropriate experimental design by identifying variables and controls.
With the continue scaling of transistor feature sizes, VLSI chip density continue …
With the continue scaling of transistor feature sizes, VLSI chip density continue increases. This results in a continue increase in the complexity VLSI technology where it has reached the point where billions of transistors are integrated on a single chip (like it is the case for System on Chip). To guarantee the satisfaction of the customers, the produced VLSI chips have to be reliable and fully tested. Verification testing and production testing represents 50 t0 60% of the cost of making VLSI chips, and are now the biggest cost of the technology. It has been known for a while that tackling the problems associated with testing VLSI chips at earlier design stage levels significantly reduces testing cost. Thus it is important for hardware designers to be exposed to concepts of VLSI testing which can help them design better product at lower cost.
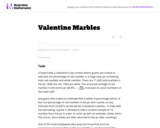
For this task, Minitab software was used to generate 100 random samples …
For this task, Minitab software was used to generate 100 random samples of size 16 from a population where the probability of obtaining a success in one draw is 33.6% (Bernoulli). Given that multiple samples of the same size have been generated, students should note that there can be quite a bit of variability among the estimates from random samples and that on average, the center of the distribution of such estimates is at the actual population value and most of the estimates themselves tend to cluster around the actual population value.
Does your business need a make-over? Are you unsure how to start? …
Does your business need a make-over? Are you unsure how to start?
Having an innovative business model is key for a profitable business and growth. In this business and management course, you will learn how to design, test and implement new business models for sustainable success.
This course introduces you to the main topics of business model innovation. You will learn what drives business model innovation and why it is valuable to you and your business. You will apply practical tools to (re)design and test a business model.
Be inspired by real-life business model examples from fellow entrepreneurs and learn from leading experts who design business model innovations. By the end of this course, you will be able to structure your thinking and communicate your business model ideas and learn how to improve your own business.
This art history video discussion examines Jan Van Eyck's "Portrait of Giovanni …
This art history video discussion examines Jan Van Eyck's "Portrait of Giovanni Arnolfini and his Wife", tempera and oil on wood, 1434 (National Gallery, London).
This art history video discussion looks at Jan van Eyck's "The Madonna …
This art history video discussion looks at Jan van Eyck's "The Madonna in the Church", c. 1438, oil on oak (Gemaldegalerie, Staatliche Museen zu Berlin).
This art history video discussion looks at Rogier van der Weyden's "The …
This art history video discussion looks at Rogier van der Weyden's "The Crucifixion, with the Virgin and Saint John the Evangelist Mourning", c. 1460, oil on panel (Philadelphia Museum of Art).
Vaping: Know the truth is a prevention-forward digital learning experience that gives …
Vaping: Know the truth is a prevention-forward digital learning experience that gives today’s students core knowledge around the dangers associated with using e-cigarettes and offers resources to help young people quit if they already vape.
Students learn how to quickly and efficiently interpret graphs, which are used …
Students learn how to quickly and efficiently interpret graphs, which are used for everyday purposes as well as engineering analysis. Through a practice handout completed as a class and a worksheet completed in small groups, students gain familiarity in talking about and interpreting graphs. They use common graph terminology such as independent variable, dependent variable, linear data, linear relationship and rate of change. The equation for calculating slope is explained. The focus is on students becoming able to clearly describe linear relationships by using the language of slope and the rate of change between variables. At lesson end, students discuss the relationship between variables as presented by the visual representation of a graph. Then they independently complete a homework handout.
No restrictions on your remixing, redistributing, or making derivative works. Give credit to the author, as required.
Your remixing, redistributing, or making derivatives works comes with some restrictions, including how it is shared.
Your redistributing comes with some restrictions. Do not remix or make derivative works.
Most restrictive license type. Prohibits most uses, sharing, and any changes.
Copyrighted materials, available under Fair Use and the TEACH Act for US-based educators, or other custom arrangements. Go to the resource provider to see their individual restrictions.