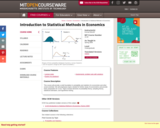
This course will provide a solid foundation in probability and statistics for …
This course will provide a solid foundation in probability and statistics for economists and other social scientists. We will emphasize topics needed for further study of econometrics and provide basic preparation for 14.32. Topics include elements of probability theory, sampling theory, statistical estimation, and hypothesis testing.
Introduction to Statistics is a resource for learning and teaching introductory statistics. …
Introduction to Statistics is a resource for learning and teaching introductory statistics. This work is in the public domain. Therefore, it can be copied and reproduced without limitation. However, we would appreciate a citation where possible. Please cite as: Online Statistics Education: A Multimedia Course of Study (http://onlinestatbook.com/). Project Leader: David M. Lane, Rice University. Instructor's manual, PowerPoint Slides, and additional questions are available.
The main goal of the course is to highlight the general assumptions …
The main goal of the course is to highlight the general assumptions and methods that underlie all statistical analysis. The purpose is to get a good understanding of the scope, and the limitations of these methods. We also want to learn as much as possible about the assumptions behind the most common methods, in order to evaluate if they apply with reasonable accuracy to a given situation. Our goal is not so much learning bread and butter techniques: these are pre-programmed in widely available and used software, so much so that a mechanical acquisition of these techniques could be quickly done "on the job". What is more challenging is the evaluation of what the results of a statistical procedure really mean, how reliable they are in given circumstances, and what their limitations are.Login: guest_oclPassword: ocl
Introductory Business Statistics is designed to meet the scope and sequence requirements …
Introductory Business Statistics is designed to meet the scope and sequence requirements of the one-semester statistics course for business, economics, and related majors. Core statistical concepts and skills have been augmented with practical business examples, scenarios, and exercises. The result is a meaningful understanding of the discipline, which will serve students in their business careers and real-world experiences.
The book "Introductory Business Statistics" by Thomas K. Tiemann explores the basic …
The book "Introductory Business Statistics" by Thomas K. Tiemann explores the basic ideas behind statistics, such as populations, samples, the difference between data and information, and most importantly sampling distributions. The author covers topics including descriptive statistics and frequency distributions, normal and t-distributions, hypothesis testing, t-tests, f-tests, analysis of variance, non-parametric tests, and regression basics. Using real-world examples throughout the text, the author hopes to help students understand how statistics works, not just how to "get the right number."
"Introductory Business Statistics with Interactive Spreadsheets - 1st Canadian Edition" is an …
"Introductory Business Statistics with Interactive Spreadsheets - 1st Canadian Edition" is an adaptation of Thomas K. Tiemann's book, "Introductory Business Statistics". In addition to covering basics such as populations, samples, the difference between data and information, and sampling distributions, descriptive statistics and frequency distributions, normal and t-distributions, hypothesis testing, t-tests, f-tests, analysis of variance, non-parametric tests, and regression basics, the following information has been added: the chi-square test and categorical variables, null and alternative hypotheses for the test of independence, simple linear regression model, least squares method, coefficient of determination, confidence interval for the average of the dependent variable, and prediction interval for a specific value of the dependent variable. This new edition also allows readers to learn the basic and most commonly applied statistical techniques in business in an interactive way -- when using the web version -- through interactive Excel spreadsheets. All information has been revised to reflect Canadian content.
Introductory Statistics follows scope and sequence requirements of a one-semester introduction to …
Introductory Statistics follows scope and sequence requirements of a one-semester introduction to statistics course and is geared toward students majoring in fields other than math or engineering. The text assumes some knowledge of intermediate algebra and focuses on statistics application over theory. Introductory Statistics includes innovative practical applications that make the text relevant and accessible, as well as collaborative exercises, technology integration problems, and statistics labs.
This is a task from the Illustrative Mathematics website that is one …
This is a task from the Illustrative Mathematics website that is one part of a complete illustration of the standard to which it is aligned. Each task has at least one solution and some commentary that addresses important aspects of the task and its potential use.
This is a first draft of a free (as in speech, not …
This is a first draft of a free (as in speech, not as in beer, [Sta02]) (although it is free as in beer as well) textbook for a one-semester, undergraduate statistics course. It was used for Math 156 at Colorado State University–Pueblo in the spring semester of 2017.
This course provides students with decision theory, estimation, confidence intervals, and hypothesis …
This course provides students with decision theory, estimation, confidence intervals, and hypothesis testing. It introduces large sample theory, asymptotic efficiency of estimates, exponential families, and sequential analysis.
Students learn about life-cycle assessment and how engineers use this technique to …
Students learn about life-cycle assessment and how engineers use this technique to determine the environmental impact of everyday products and processes. As they examine what’s involved in making and consuming cupcakes, a snack enjoyed by millions of people every year, students learn about the production, use and disposal phases of an object’s life cycle. With the class organized into six teams, students calculate data for each phase of a cupcake’s life cycle—wet ingredients, dry ingredients, baking materials, oven baking, frosting, liner disposal—and calculate energy usage and greenhouse gases emitted from making one cupcake. They use ratios and fractions, and compare options for some of the life-cycle stages, such as different paper wrapper endings (disposal to landfills or composting) in order to make a life-cycle plan with a lower environmental impact. This activity opens students’ eyes to see the energy use in the cradle-to-grave lives of everyday products. Pre/post-quizzes, worksheets, activity cards, Excel® workbook and visual aids are provided.
In this class, students use data and systems knowledge to build models …
In this class, students use data and systems knowledge to build models of complex socio-technical systems for improved system design and decision-making. Students will enhance their model-building skills, through review and extension of functions of random variables, Poisson processes, and Markov processes; move from applied probability to statistics via Chi-squared t and f tests, derived as functions of random variables; and review classical statistics, hypothesis tests, regression, correlation and causation, simple data mining techniques, and Bayesian vs. classical statistics. A class project is required.
Students learn the physical properties of sound, how it travels and how …
Students learn the physical properties of sound, how it travels and how noise impacts human health—including the quality of student learning. They learn different techniques that engineers use in industry to monitor noise level exposure and then put their knowledge to work by using a smart phone noise meter app to measure the noise level at an area of interest, such as busy roadways near the school. They devise an experimental procedure to measure sound levels in their classroom, at the source of loud noise (such as a busy road or construction site), and in between. Teams collect data using smart phones/tablets, microphones and noise apps. They calculate wave properties, including frequency, wavelength and amplitude. A PowerPoint® presentation, three worksheets and a quiz are provided.
This lesson teaches students how to make decisions in the face of …
This lesson teaches students how to make decisions in the face of uncertainty by using decision trees. It is aimed for high school kids with a minimal background in probability; the students only need to know how to calculate the probability of two uncorrelated events both occurring (ie flipping 2 heads in a row). Over the course of this lesson, students will learn about the role of uncertainty in decision making, how to make and use a decision tree, how to use limiting cases to develop an intuition, and how this applies to everyday life. The video portion is about fifteen minutes, and the whole lesson, including activities, should be completed in about forty-five minutes. Some of the activities call for students to work in pairs, but a larger group is also okay, especially for the discussion centered activities. The required materials for this lesson are envelopes, small prizes, and some things similar in size and shape to the prize.
In this group task students collect data and analyze from the class …
In this group task students collect data and analyze from the class to answer the question "is there an association between whether a student plays a sport and whether he or she plays a musical instrument? "
Natural Resources Biometrics begins with a review of descriptive statistics, estimation, and …
Natural Resources Biometrics begins with a review of descriptive statistics, estimation, and hypothesis testing. The following chapters cover one- and two-way analysis of variance (ANOVA), including multiple comparison methods and interaction assessment, with a strong emphasis on application and interpretation. Simple and multiple linear regressions in a natural resource setting are covered in the next chapters, focusing on correlation, model fitting, residual analysis, and confidence and prediction intervals. The final chapters cover growth and yield models, volume and biomass equations, site index curves, competition indices, importance values, and measures of species diversity, association, and community similarity.
This class introduces elementary programming concepts including variable types, data structures, and …
This class introduces elementary programming concepts including variable types, data structures, and flow control. After an introduction to linear algebra and probability, it covers numerical methods relevant to mechanical engineering, including approximation (interpolation, least squares and statistical regression), integration, solution of linear and nonlinear equations, ordinary differential equations, and deterministic and probabilistic approaches. Examples are drawn from mechanical engineering disciplines, in particular from robotics, dynamics, and structural analysis. Assignments require MATLAB programming.
No restrictions on your remixing, redistributing, or making derivative works. Give credit to the author, as required.
Your remixing, redistributing, or making derivatives works comes with some restrictions, including how it is shared.
Your redistributing comes with some restrictions. Do not remix or make derivative works.
Most restrictive license type. Prohibits most uses, sharing, and any changes.
Copyrighted materials, available under Fair Use and the TEACH Act for US-based educators, or other custom arrangements. Go to the resource provider to see their individual restrictions.