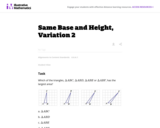
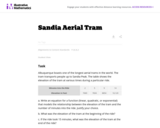
This is the second version of a task asking students to find …
This is the second version of a task asking students to find the areas of triangles that have the same base and height. This presentation is more abstract as students are not using physical models.
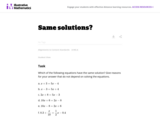
The purpose of this task is to provide an opportunity for students …
The purpose of this task is to provide an opportunity for students to reason about equivalence of equations. The instruction to give reasons that do not depend on solving the equation is intended to focus attention on the transformation of equations as a deductive step.
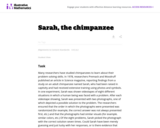
The purpose of this task is to give students experience in using …
The purpose of this task is to give students experience in using simulation to determine if observed results are consistent with a given model (in this case, the Ňjust guessingÓ model). Part (i) also addresses the role of random assignment in the design of an experiment and assesses understanding of this concept.
This task involves two aspects of statistical reasoning: providing a probabilistic model …
This task involves two aspects of statistical reasoning: providing a probabilistic model for the situation at hand, and defining a way to collect data to determine whether or not the observed data is reasonably likely to occur under the chosen model. When guessing between two choices, there is no reason to suspect that one outcome is more likely than the other. Thus, a model that assumes the two outcomes to be equally likely (such as flipping a coin) is appropriate.
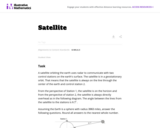
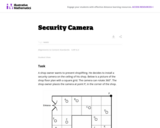
This task is an example of applying geometric methods to solve design …
This task is an example of applying geometric methods to solve design problems and satisfy physical constraints. This task models a satellite orbiting the earth in communication with two control stations located miles apart on earthsŐ surface.
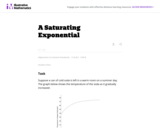
The context of this task is a familiar one: a cold beverage …
The context of this task is a familiar one: a cold beverage warms once it is taken out of the refrigerator. Rather than giving the explicit function governing this warmth, a graph is presented along with the general form of the function. Students must then interpret the graph in order to understand more specific details regarding the function.
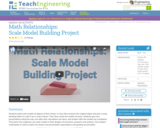
Students build scale models of objects of their choice. In class they …
Students build scale models of objects of their choice. In class they measure the original object and pick a scale, deciding either to scale it up or scale it down. Then they create the models at home. Students give two presentations along the way, one after their calculations are done, and another after the models are completed. They learn how engineers use scale models in their designs of structures, products and systems. Two student worksheets as well as rubrics for project and presentation expectations and grading are provided.
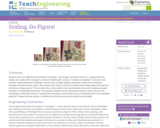
Students learn how different characteristics of shapes—side lengths, perimeter and area—change when …
Students learn how different characteristics of shapes—side lengths, perimeter and area—change when the shapes are scaled, either enlarged or reduced. Student pairs conduct a “scaling investigation” to measure and calculate shape dimensions (rectangle, quarter circle, triangle; lengths, perimeters, areas) from a bedroom floorplan provided at three scales. They analyze their data to notice the mathematical relationships that hold true during the scaling process. They see how this can be useful in real-world situations like when engineers design wearable or implantable biosensors. This prepares students for the associated activity in which they use this knowledge to help them reduce or enlarge their drawings as part of the process of designing their own wearables products. Pre/post-activity quizzes, a worksheet and wrap-up concepts handout are provided.
This word problem may be used for instructional or assessment purposes, depending …
This word problem may be used for instructional or assessment purposes, depending on where students are in their understanding of addition and how the teacher supports them.
This subject exposes students to a variety of visualization techniques so that …
This subject exposes students to a variety of visualization techniques so that they learn to understand the work involved in producing them and to critically assess the power and limits of each. Students concentrate on areas where visualizations are crucial for meaning making and data production. Drawing on scholarship in science and technology studies on visualization, critical art theory, and core discussions in science and engineering, students work through a series of case studies in order to become better readers and producers of visualizations.
This is a task from the Illustrative Mathematics website that is one …
This is a task from the Illustrative Mathematics website that is one part of a complete illustration of the standard to which it is aligned. Each task has at least one solution and some commentary that addresses important aspects of the task and its potential use.
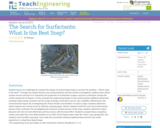
Student teams are challenged to evaluate the design of several liquid soaps …
Student teams are challenged to evaluate the design of several liquid soaps to answer the question, “Which soap is the best?” Through two simple teacher class demonstrations and the activity investigation, students learn about surface tension and how it is measured, the properties of surfactants (soaps), and how surfactants change the surface properties of liquids. As they evaluate the engineering design of real-world products (different liquid dish washing soap brands), students see the range of design constraints such as cost, reliability, effectiveness and environmental impact. By investigating the critical micelle concentration of various soaps, students determine which requires less volume to be an effective cleaning agent, factors related to both the cost and environmental impact of the surfactant. By investigating the minimum surface tension of the soap, students determine which dissolves dirt and oil most effectively and thus cleans with the least effort. Students evaluate these competing criteria and make their own determination as to which of five liquid soaps make the “best” soap, giving their own evidence and scientific reasoning. They make the connection between gathered data and the real-world experience in using these liquid soaps.
Students learn how to create two-dimensional representations of three-dimensional objects by utilizing …
Students learn how to create two-dimensional representations of three-dimensional objects by utilizing orthographic projection techniques. They build shapes using cube blocks and then draw orthographic and isometric views of those shapes—which are the side views, such as top, front, right—with no depth indicated. Then working in pairs, one blindfolded partner describes a shape by feel alone as the other partner draws what is described. A worksheet is provided. This activity is part of a multi-activity series towards improving spatial visualization skills.
No restrictions on your remixing, redistributing, or making derivative works. Give credit to the author, as required.
Your remixing, redistributing, or making derivatives works comes with some restrictions, including how it is shared.
Your redistributing comes with some restrictions. Do not remix or make derivative works.
Most restrictive license type. Prohibits most uses, sharing, and any changes.
Copyrighted materials, available under Fair Use and the TEACH Act for US-based educators, or other custom arrangements. Go to the resource provider to see their individual restrictions.