Quantitative analysis of uncertainty and risk for engineering applications. Fundamentals of probability, …
Quantitative analysis of uncertainty and risk for engineering applications. Fundamentals of probability, random processes, statistics, and decision analysis. Random variables and vectors, uncertainty propagation, conditional distributions, and second-moment analysis. Introduction to system reliability. Bayesian analysis and risk-based decision. Estimation of distribution parameters, hypothesis testing, and simple and multiple linear regressions. Poisson and Markov processes. Emphasis on application to engineering problems.
This course develops logical, empirically based arguments using statistical techniques and analytic …
This course develops logical, empirically based arguments using statistical techniques and analytic methods. Elementary statistics, probability, and other types of quantitative reasoning useful for description, estimation, comparison, and explanation are covered. Emphasis is on the use and limitations of analytical techniques in planning practice.
A two-semester subject on quantum theory, stressing principles: uncertainty relation, observables, eigenstates, …
A two-semester subject on quantum theory, stressing principles: uncertainty relation, observables, eigenstates, eigenvalues, probabilities of the results of measurement, transformation theory, equations of motion, and constants of motion. Symmetry in quantum mechanics, representations of symmetry groups. Variational and perturbation approximations. Systems of identical particles and applications. Time-dependent perturbation theory. Scattering theory: phase shifts, Born approximation. The quantum theory of radiation. Second quantization and many-body theory. Relativistic quantum mechanics of one electron. This is the second semester of a two-semester subject on quantum theory, stressing principles. Topics covered include: time-dependent perturbation theory and applications to radiation, quantization of EM radiation field, adiabatic theorem and Berry's phase, symmetries in QM, many-particle systems, scattering theory, relativistic quantum mechanics, and Dirac equation.
Over several days, students learn about composites, including carbon-fiber-reinforced polymers, and their …
Over several days, students learn about composites, including carbon-fiber-reinforced polymers, and their applications in modern life. This prepares students to be able to put data from an associated statistical analysis activity into context as they conduct meticulous statistical analyses to evaluate/determine the effectiveness of carbon fiber patches to repair steel. This lesson and its associated activity are suitable for use during the last six weeks of an AP Statistics course; see the topics and timing note for details. A PowerPoint® presentation and post-quiz are provided.
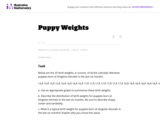
This is a task from the Illustrative Mathematics website that is one …
This is a task from the Illustrative Mathematics website that is one part of a complete illustration of the standard to which it is aligned. Each task has at least one solution and some commentary that addresses important aspects of the task and its potential use.
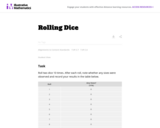
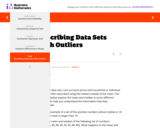
his task is intended as a classroom activity. Student pool the results …
his task is intended as a classroom activity. Student pool the results of many repetitions of the random phenomenon (rolling dice) and compare their results to the theoretical expectation they develop by considering all possible outcomes of rolling two dice. This gives them a concrete example of what we mean by long term relative frequency.
This is a task from the Illustrative Mathematics website that is one …
This is a task from the Illustrative Mathematics website that is one part of a complete illustration of the standard to which it is aligned. Each task has at least one solution and some commentary that addresses important aspects of the task and its potential use.
This task involves two aspects of statistical reasoning: providing a probabilistic model …
This task involves two aspects of statistical reasoning: providing a probabilistic model for the situation at hand, and defining a way to collect data to determine whether or not the observed data is reasonably likely to occur under the chosen model. When guessing between two choices, there is no reason to suspect that one outcome is more likely than the other. Thus, a model that assumes the two outcomes to be equally likely (such as flipping a coin) is appropriate.
This is a task from the Illustrative Mathematics website that is one …
This is a task from the Illustrative Mathematics website that is one part of a complete illustration of the standard to which it is aligned. Each task has at least one solution and some commentary that addresses important aspects of the task and its potential use.
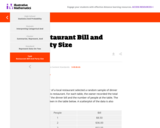
As if they are engineers, students are tasked to design solar-powered model …
As if they are engineers, students are tasked to design solar-powered model vehicles that are speedy and compact in order to make recommendations to a local car sales company. Teams familiarize themselves with the materials by building solar-panel model car prototypes, following kit instructions, which they test for speed. After making design improvements, they test again. Then they take measurements and calculate the volume of each team’s vehicle. They rank all teams’ vehicles by speed and by size. After data analyses, reflection and team discussion, students write recommendations to the car company about the vehicle they think is best for consumers. Youngsters experience key portions of the engineering design process and learn the importance of testing and collaborating in order to make better products. Pre/post-quizzes and numerous worksheets and handouts are provided.
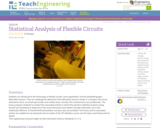
Students are introduced to the technology of flexible circuits, some applications and …
Students are introduced to the technology of flexible circuits, some applications and the photolithography fabrication process. They are challenged to determine if the fabrication process results in a change in the circuit dimensions since, as circuits get smaller and smaller (nano-circuits), this could become very problematic. The lesson prepares students to conduct the associated activity in which they perform statistical analysis (using Excel® and GeoGebra) to determine if the circuit dimension sizes before and after fabrication are in fact statistically different. A PowerPoint® presentation and post-quiz are provided. This lesson and its associated activity are suitable for use during the last six weeks of the AP Statistics course; see the topics and timing note for details.
Students apply pre-requisite statistics knowledge and concepts learned in an associated lesson …
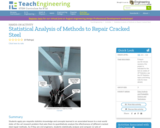
Students apply pre-requisite statistics knowledge and concepts learned in an associated lesson to a real-world state-of-the-art research problem that asks them to quantitatively analyze the effectiveness of different cracked steel repair methods. As if they are civil engineers, students statistically analyze and compare 12 sets of experimental data from seven research centers around the world using measurements of central tendency, five-number summaries, box-and-whisker plots and bar graphs. The data consists of the results from carbon-fiber-reinforced polymer patched and unpatched cracked steel specimens tested under the same stress conditions. Based on their findings, students determine the most effective cracked steel repair method, create a report, and present their results, conclusions and recommended methods to the class as if they were presenting to the mayor and city council. This activity and its associated lesson are suitable for use during the last six weeks of the AP Statistics course; see the topics and timing note for details.
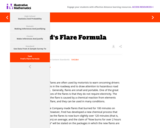
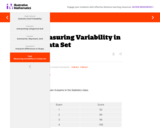
Working as if they are engineers aiming to analyze and then improve …
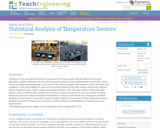
Working as if they are engineers aiming to analyze and then improve data collection devices for precision agriculture, students determine how accurate temperature sensors are by comparing them to each other. Teams record soil temperature data during a class period while making changes to the samples to mimic real-world crop conditions—such as the addition of water and heat and the removal of the heat. Groups analyze their collected data by finding the mean, median, mode, and standard deviation. Then, the class combines all the team data points in order to compare data collected from numerous devices and analyze the accuracy of their recording devices by finding the standard deviation of temperature readings at each minute. By averaging the standard deviations of each minute’s temperature reading, students determine the accuracy of their temperature sensors. Students present their findings and conclusions, including making recommendations for temperature sensor improvements.
This is a new approach to an introductory statistical inference textbook, motivated …
This is a new approach to an introductory statistical inference textbook, motivated by probability theory as logic. It is targeted to the typical Statistics 101 college student, and covers the topics typically covered in the first semester of such a course. It is freely available under the Creative Commons License, and includes a software library in Python for making some of the calculations and visualizations easier.
No restrictions on your remixing, redistributing, or making derivative works. Give credit to the author, as required.
Your remixing, redistributing, or making derivatives works comes with some restrictions, including how it is shared.
Your redistributing comes with some restrictions. Do not remix or make derivative works.
Most restrictive license type. Prohibits most uses, sharing, and any changes.
Copyrighted materials, available under Fair Use and the TEACH Act for US-based educators, or other custom arrangements. Go to the resource provider to see their individual restrictions.