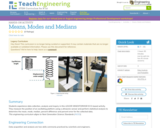
Students experience data collection, analysis and inquiry in this LEGO® MINDSTORMS® NXT …
Students experience data collection, analysis and inquiry in this LEGO® MINDSTORMS® NXT -based activity. They measure the position of an oscillating platform using a ultrasonic sensor and perform statistical analysis to determine the mean, mode, median, percent difference and percent error for the collected data.
The Sun moves across the sky at an approximately constant rate because …
The Sun moves across the sky at an approximately constant rate because of the rotation of the Earth. By measuring how fast the Sun moves, you can work out how big the Sun appears in the sky. All you need are some household items and about 30 minutes on a sunny day.
In this task students work with partners to measure themselves by laying …
In this task students work with partners to measure themselves by laying multiple copies of a shorter object that represents the length unit end to end. It gives students the opportunity to discuss the need to be careful when measuring.
Students learn the metric units engineers use to measure mass, distance (or …
Students learn the metric units engineers use to measure mass, distance (or length) and volume. They make estimations using these units and compare their guesses with actual values. To introduce the concepts, the teacher needs access to a meter stick, a one-liter bottle, a glass container that measures milliliters and a gram scale.
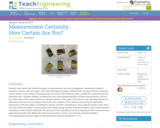
Students learn about the statistical analysis of measurements and error propagation, reviewing …
Students learn about the statistical analysis of measurements and error propagation, reviewing concepts of precision, accuracy and error types. This is done through calculations related to the concept of density. Students work in teams to each measure the dimensions and mass of five identical cubes, compile the measurements into small data sets, calculate statistics including the mean and standard deviation of these measurements, and use the mean values of the measurements to calculate density of the cubes. Then they use this calculated density to determine the mass of a new object made of the same material. This is done by measuring the appropriate dimensions of the new object, calculating its volume, and then calculating its mass using the density value. Next, the mass of the new object is measured by each student group and the standard deviation of the measurements is calculated. Finally, students determine the accuracy of the calculated mass by comparing it to the measured mass, determining whether the difference in the measurements is more or less than the standard deviation.
This course is an introduction to measurement technology and describes the theoretical …
This course is an introduction to measurement technology and describes the theoretical foundations and practical examples of measurement systems. The analyzing of measurements problems and specifying of measurements systems are the main subjects that are treated in this course, where the main focus will be on the different kind of measurement errors and the concept of uncertainty in measurement results. Electronic measurement instrumentation will be introduced; a number of conventional sensors for the measurement of non-electronic variables will be described, as well as electronic circuits for the reading of the sensors.-Analyzing of measurement problems-Describing of measurement problems -Analyzing the measurement quantity-Analyzing the measurement boundaries for a quantity to be measured in different circumstances-Professional use of the measurement system-Describing the operating principle of conventional instruments for electronic measurements.-Comparing the available measurement instruments on the basis of quality and accuracy.-Realization of simple measurement setups.-Using the electronic sensor for the measurement of non-electronic variables.-Using a simple signal processing circuits for the reading of the sensors.-Analyzing, presenting and interpreting of measurement results;-Recognizing and describing of error sources.
This course, Measurements for Water is in Dutch, but the following parts …
This course, Measurements for Water is in Dutch, but the following parts are in English:Lectures: Waterbalans Water balance)ReadingsDit vak gaat in op het hoe te doen van typische metingen op het vakgebied van gezondheidstechniek (waterkwaliteit), hydrologie, waterbeheer, waterbouw en vloeistofmechanica (waterkwantiteit).Onderdelen hierin zijn: het herkennen van de relevante parameters, leren over meetmethodes, meetapparatuur, nauwkeurigheid, opstellen van een meetplan, veiligheid, het zelf doen van metingen (laboratorium e/o in het veld) en bewerken en verwerken van gegevens.In een workshop wordt er geleerd met beschikbare electronica componenten een eigen meetsensor te bouwen.Leerdoelen- In staat zijn aan te geven welke parameters van belang zijn bij een bepaald proces- In staat zijn aan te geven hoe de parameters gemeten kunnen worden- Geschikte meetapparatuur kunnen kiezen- Een meetplan kunnen maken (uitvoering, tijd, duur, kosten, veiligheid)- Basis principes electronica in de meettechniek begrijpen en kunnen toepassen
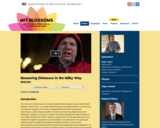
The main aim of this lesson is to show students that distances …
The main aim of this lesson is to show students that distances may be determined without a meter stick—a concept fundamental to such measurements in astronomy. It introduces students to the main concepts behind the first rung of what astronomers call the distance ladder. The four main learning objectives are the following: 1) Explore, in practice, a means of measuring distances without what we most often consider the “direct” means: a meter stick; 2) Understand the limits of a method through the exploration of uncertainties; 3) Understand in the particular method used, the relationship between baseline and the accuracy of the measurement; and 4) Understand the astronomical applications and implications of the method and its limits. Students should be able to use trigonometry and know the relation between trigonometric functions and the triangle. A knowledge of derivatives is also needed to obtain the expression for the uncertainty on the distance measured. Students will need cardboard cut into disks. The number of disks is essentially equal to half the students in the class. Two straight drink straws and one pin per disk. Students will also need a protractor. The lesson should not take more than 50 minutes to complete if the students have the mathematical ability mentioned above. This lesson is complimentary to the BLOSSOMS lesson, "The Parallax Activity." The two lessons could be used sequentially - this one being more advanced - or they could be used separately.
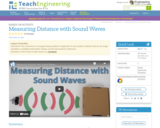
Students learn about sound waves and use them to measure distances between …
Students learn about sound waves and use them to measure distances between objects. They explore how engineers incorporate ultrasound waves into medical sonogram devices and ocean sonar equipment. Students learn about properties, sources and applications of three types of sound waves, known as the infra-, audible- and ultra-sound frequency ranges. They use ultrasound waves to measure distances and understand how ultrasonic sensors are engineered.
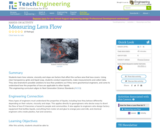
Students learn how volume, viscosity and slope are factors that affect the …
Students learn how volume, viscosity and slope are factors that affect the surface area that lava covers. Using clear transparency grids and liquid soap, students conduct experiments, make measurements and collect data. They also brainstorm possible solutions to lava flow problems as if they were geochemical engineers, and come to understand how the properties of lava are applicable to other liquids.
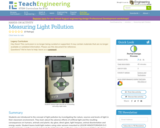
Students are introduced to the concept of light pollution by investigating the …
Students are introduced to the concept of light pollution by investigating the nature, sources and levels of light in their classroom environment. They learn about the adverse effects of artificial light and the resulting consequences on humans, animals and plants: sky glow, direct glare, light trespass, animal disorientation and energy waste. Student teams build light meters using light sensors mounted to LEGO® MINDSTORMS® NXT intelligent bricks and then record and graph the light intensity emitted in various classroom lighting situations. They are introduced to the engineering concepts of sensors, lux or light meter, and lumen and lux (lx) illuminance units. Through this activity, students also learn how to better use light and save energy as well as some of the technologies designed by engineers to reduce light pollution and energy waste.
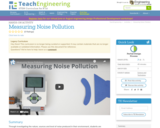
Through investigating the nature, sources and level of noise produced in their …
Through investigating the nature, sources and level of noise produced in their environment, students are introduced to the concept of noise pollution. They learn about the undesirable and disturbing effects of noise and the resulting consequences on people's health, as well as on the health of the environment. They use a sound level meter that consists of a sound sensor attached to the LEGO® NXT Intelligent Brick to record the noise level emitted by various sources. They are introduced to engineering concepts such as sensors, decibel (dB) measurements, and sound pressure used to measure the noise level. Students are introduced to impairments resulting from noise exposure such as speech interference, hearing loss, sleep disruption and reduced productivity. They identify potential noise pollution sources, and based on recorded data, they classify these sources into levels of annoyance. Students also explore the technologies designed by engineers to protect against the harmful effects of noise pollution.
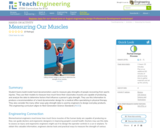
Student teams build model hand dynamometers used to measure grip strengths of …
Student teams build model hand dynamometers used to measure grip strengths of people recovering from sports injuries. They use their models to measure how much force their classmates muscles are capable of producing, and analyze the data to determine factors that influence a person's grip strength. They use this information to produce a recommendation of a hand dynamometer design for a medical office specializing in physical therapy. They also consider the many other ways grip strength data is used by engineers to design everyday products.
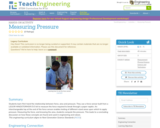
Students learn first-hand the relationship between force, area and pressure. They use …
Students learn first-hand the relationship between force, area and pressure. They use a force sensor built from a LEGO® MINDSTORMS® NXT kit to measure the force required to break through a paper napkin. An interchangeable top at the end of the force sensor enables testing of different-sized areas upon which to apply pressure. Measuring the force, and knowing the area, students compute the pressure. This leads to a concluding discussion on how these concepts are found and used in engineering and nature.
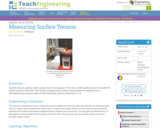
Students observe capillary action in glass tubes of varying sizes. Then they …
Students observe capillary action in glass tubes of varying sizes. Then they use the capillary action to calculate the surface tension in each tube. They find the average surface tensions and calculate the statistical errors.
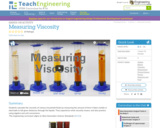
Students calculate the viscosity of various household fluids by measuring the amount …
Students calculate the viscosity of various household fluids by measuring the amount of time it takes marble or steel balls to fall given distances through the liquids. They experience what viscosity means, and also practice using algebra and unit conversions.
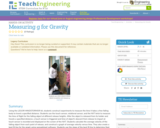
Using the LEGO MINDSTORMS(TM) NXT kit, students construct experiments to measure the …
Using the LEGO MINDSTORMS(TM) NXT kit, students construct experiments to measure the time it takes a free falling body to travel a specified distance. Students use the touch sensor, rotational sensor, and the NXT brick to measure the time of flight for the falling object at different release heights. After the object is released from its holder and travels a specified distance, a touch sensor is triggered and time of object's descent from release to impact at touch sensor is recorded and displayed on the screen of the NXT. Students calculate the average velocity of the falling object from each point of release, and construct a graph of average velocity versus time. They also create a best fit line for the graph using spreadsheet software. Students use the slope of the best fit line to determine their experimental g value and compare this to the standard value of g.
No restrictions on your remixing, redistributing, or making derivative works. Give credit to the author, as required.
Your remixing, redistributing, or making derivatives works comes with some restrictions, including how it is shared.
Your redistributing comes with some restrictions. Do not remix or make derivative works.
Most restrictive license type. Prohibits most uses, sharing, and any changes.
Copyrighted materials, available under Fair Use and the TEACH Act for US-based educators, or other custom arrangements. Go to the resource provider to see their individual restrictions.