This lesson introduces the MRI Safety Grand Challenge question. Students are asked …
This lesson introduces the MRI Safety Grand Challenge question. Students are asked to write journal responses to the question and brainstorm what information they will need to answer the question. The ideas are shared with the class and recorded. Students then watch a video interview with a real life researcher to gain a professional perspective on MRI safety and brainstorm any additional ideas. The associated activity provides students the opportunity to visualize magnetic fields.
This lesson introduces the Bone Module Grand Challenge question. Students are asked …
This lesson introduces the Bone Module Grand Challenge question. Students are asked to write their initial responses to the question alone. They will then brainstorm ideas with one other student. Finally, the ideas are shared with the class and recorded. It is important for students to gather information to decide whether or not this condition is hereditary. Students then watch two videos about osteoporosis. Grand Challenge Question: When you get home from school, your mother grabs you, and you rush to the hospital. Your grandmother fell and was rushed to the emergency room. The doctor tells your family your grandmother has a fractured hip, and he is referring her to an orthopedic specialist. The orthopedic doctor decides to perform a DEXA scan. The result showed her bone mineral density (BMD) was -3.3. What would be a probable diagnosis to her condition? What are some possible causes of her condition? Should her family be worried that this condition is hereditary, and if so, what are possible prevented measures they could take to prevent this from happening to them? What statistical method did you use to determine if the condition is hereditary?
Students are introduced to the Robotics Peripheral Vision Grand Challenge question. They …
Students are introduced to the Robotics Peripheral Vision Grand Challenge question. They are asked to write journal responses to the question and brainstorm what information they require to answer the question. Their ideas are shared with the class and recorded. Then, students share their ideas with each other and brainstorm any additional ideas. Next, students draw a basis for the average peripheral vision of humans and then compare that range to the range of two different focal lengths in a camera. Through the associated activity provides, students see the differences between human and computer vision.
This art history video discussion examines Grant Wood's "American Gothic", 1930, oil …
This art history video discussion examines Grant Wood's "American Gothic", 1930, oil on beaver board, 78 x 65.3 cm / 30-3/4 x 25-3/4 inches (The Art Institute of Chicago).
Students use graph theory to create social graphs for their own social …
Students use graph theory to create social graphs for their own social networks and apply what learn to create a graph representing the social dynamics found in a dramatic text. Students then derive meaning based on what they know about the text from the graphs they created. Students learn graph theory vocabulary, as well as engineering applications of graph theory.
This textbook -- written by a group of select experts with a …
This textbook -- written by a group of select experts with a focus on different aspects of the design process, from creation to production -- addresses the many steps of creating and then producing physical, printed, or other imaged products that people interact with on a daily basis. It covers the concept that, while most modern graphic design is created on computers using design software, the ideas and concepts don’t stay on the computer. The ideas need to be completed in the computer software, then progress to an imaging (traditionally referred to as printing) process. Keywords are highlighted throughout and summarized in a Glossary at the end of the book, and each chapter includes exercises and suggested readings.
Students learn about an important characteristic of lines: their slopes. Slope can …
Students learn about an important characteristic of lines: their slopes. Slope can be determined either in graphical or algebraic form. Slope can also be described as positive, negative, zero or undefined. Students get an explanation of when and how these different types of slope occur. Finally, they learn how slope relates to parallel and perpendicular lines. When two lines are parallel, they have the same slope and when they are perpendicular their slopes are negative reciprocals of one another.
Students analyze their social networks using graph theory. They gather data on …
Students analyze their social networks using graph theory. They gather data on their own social relationships, either from Facebook interactions or the interactions they have throughout the course of a day, recording it in Microsoft Excel and using Cytoscape (a free, downloadable application) to generate social network graphs that visually illustrate the key persons (nodes) and connections between them (edges). The nodes in the Cytoscape graphs are color-coded and sized according to the importance of the node (in this activity, nodes are people in students' social networks). After the analysis, the graphs are further examined to see what can be learned from the visual representation. Students gain practice with graph theory vocabulary, including node, edge, betweeness centrality and degree on interaction, and learn about a range of engineering applications of graph theory.
Students are introduced to different ways of displaying visual spectra, including colored …
Students are introduced to different ways of displaying visual spectra, including colored "barcode" spectra, like those produced by a diffraction grating, and line plots displaying intensity versus color, or wavelength. Students learn that a diffraction grating acts like a prism, bending light into its component colors.
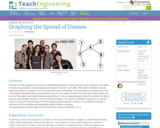
Students simulate disease transmission by collecting data based on their proximity to …
Students simulate disease transmission by collecting data based on their proximity to other students. One option for measuring proximity is by having Bluetooth devices "discover" each other. After data is collected, students apply graph theory to analyze it, and summarize their data and findings in lab report format. Students learn real-world engineering applications of graph theory and see how numerous instances of real-world relationships can be more thoroughly understood by applying graph theory. Also, by applying graph theory the students are able to come up with possible solutions to limit the spread of disease. The activity is intended to be part of a computer science curriculum and knowledge of the Java programming language is required. To complete the activity, a computer with Java installed and appropriate editing software is needed.
This task addresses an important issue about inverse functions. In this case …
This task addresses an important issue about inverse functions. In this case the function f is the inverse of the function g but g is not the inverse of f unless the domain of f is restricted.
This task requires students to recognize the graphs of different (positive) powers …
This task requires students to recognize the graphs of different (positive) powers of x. There are several important aspects to these graphs. First, the graphs of even powers of x all open upward as x grows in the positive or negative direction. The larger the even power, the flatter these graphs look near 0 and the more rapidly they increase once the distance of x from 0 excedes 1.
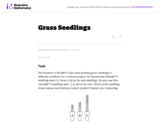
This exploration can be done in class near the beginning of a …
This exploration can be done in class near the beginning of a unit on graphing parabolas. Students need to be familiar with intercepts, and need to know what the vertex is.
Students learn about water poverty and how water engineers can develop appropriate …
Students learn about water poverty and how water engineers can develop appropriate solutions to a problem that is plaguing nearly a sixth of the world's population. Students follow the engineering design process to design a gravity-fed water system. They choose between different system parameters such as pipe sizes, elevation differentials between entry and exit pipes, pipe lengths and tube locations to find a design that provides the maximum flow and minimum water turbidity (cloudiness) at the point of use. In this activity, students play the role of water engineers by designing and building model gravity-fed water systems, learning the key elements necessary for viable projects that help improve the lives people in developing communities.
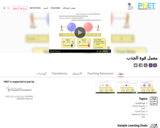
Visualize the gravitational force that two objects exert on each other. Change …
Visualize the gravitational force that two objects exert on each other. Change properties of the objects in order to see how it changes the gravity force.
Visualize the gravitational force that two objects exert on each other. Change …
Visualize the gravitational force that two objects exert on each other. Change properties of the objects in order to see how it changes the gravity force.
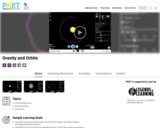
Move the sun, earth, moon and space station to see how it …
Move the sun, earth, moon and space station to see how it affects their gravitational forces and orbital paths. Visualize the sizes and distances between different heavenly bodies, and turn off gravity to see what would happen without it!
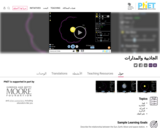
Move the sun, earth, moon and space station to see how it …
Move the sun, earth, moon and space station to see how it affects their gravitational forces and orbital paths. Visualize the sizes and distances between different heavenly bodies, and turn off gravity to see what would happen without it!
No restrictions on your remixing, redistributing, or making derivative works. Give credit to the author, as required.
Your remixing, redistributing, or making derivatives works comes with some restrictions, including how it is shared.
Your redistributing comes with some restrictions. Do not remix or make derivative works.
Most restrictive license type. Prohibits most uses, sharing, and any changes.
Copyrighted materials, available under Fair Use and the TEACH Act for US-based educators, or other custom arrangements. Go to the resource provider to see their individual restrictions.