For this task, Minitab software was used to generate 100 random samples …
For this task, Minitab software was used to generate 100 random samples of size 16 from a population where the probability of obtaining a success in one draw is 33.6% (Bernoulli). Given that multiple samples of the same size have been generated, students should note that there can be quite a bit of variability among the estimates from random samples and that on average, the center of the distribution of such estimates is at the actual population value and most of the estimates themselves tend to cluster around the actual population value.
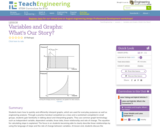
Students learn how to quickly and efficiently interpret graphs, which are used …
Students learn how to quickly and efficiently interpret graphs, which are used for everyday purposes as well as engineering analysis. Through a practice handout completed as a class and a worksheet completed in small groups, students gain familiarity in talking about and interpreting graphs. They use common graph terminology such as independent variable, dependent variable, linear data, linear relationship and rate of change. The equation for calculating slope is explained. The focus is on students becoming able to clearly describe linear relationships by using the language of slope and the rate of change between variables. At lesson end, students discuss the relationship between variables as presented by the visual representation of a graph. Then they independently complete a homework handout.
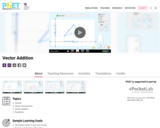
Learn how to add vectors. Drag vectors onto a graph, change their …
Learn how to add vectors. Drag vectors onto a graph, change their length and angle, and sum them together. The magnitude, angle, and components of each vector can be displayed in several formats.
Learn how to add vectors. Drag vectors onto a graph, change their …
Learn how to add vectors. Drag vectors onto a graph, change their length and angle, and sum them together. The magnitude, angle, and components of each vector can be displayed in several formats.
This is a text on elementary multivariable calculus, designed for students who …
This is a text on elementary multivariable calculus, designed for students who have completed courses in single-variable calculus. The traditional topics are covered: basic vector algebra; lines, planes and surfaces; vector-valued functions; functions of 2 or 3 variables; partial derivatives; optimization; multiple integrals; line and surface integrals.
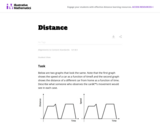
In this task students interpret two graphs that look the same but …
In this task students interpret two graphs that look the same but show very different quantities. The first graph gives information about how fast a car is moving while the second graph gives information about the position of the car. This problem works well to generate a class or small group discussion. Students learn that graphs tell stories and have to be interpreted by carefully thinking about the quantities shown.
This task could be used in instructional activities designed to build understandings …
This task could be used in instructional activities designed to build understandings of fraction division. With teacher guidance, it could be used to develop knowledge of the common denominator approach and the underlying rationale.
For this maker challenge, students become biomedical engineers who design, create, and …
For this maker challenge, students become biomedical engineers who design, create, and test a medical device that measures a patient’s pulse using a microcontroller, LED, and light sensor. Students use data collected from the device they build to determine how to best visualize the results, so that a doctor can view the patient’s pulse on the computer screen. During the challenge, students learn about basic coding, the capabilities of microcontrollers, how sensors gather data, how the human circulatory system works, and how to plot real data. Finally, students are challenged to make their systems portable so that they create wearable health technology. This is a great project for a high school senior design team project.
This short video and interactive assessment activity is designed to teach fourth …
This short video and interactive assessment activity is designed to teach fourth graders about visually comparing weight and balancing a scale (metric units).
This short video and interactive assessment activity is designed to teach fourth …
This short video and interactive assessment activity is designed to teach fourth graders about visually finding weights and calculate totals (metric units).
No restrictions on your remixing, redistributing, or making derivative works. Give credit to the author, as required.
Your remixing, redistributing, or making derivatives works comes with some restrictions, including how it is shared.
Your redistributing comes with some restrictions. Do not remix or make derivative works.
Most restrictive license type. Prohibits most uses, sharing, and any changes.
Copyrighted materials, available under Fair Use and the TEACH Act for US-based educators, or other custom arrangements. Go to the resource provider to see their individual restrictions.