This is a task from the Illustrative Mathematics website that is one …
This is a task from the Illustrative Mathematics website that is one part of a complete illustration of the standard to which it is aligned. Each task has at least one solution and some commentary that addresses important aspects of the task and its potential use.
This course provides an introduction to probability and statistics, with emphasis on …
This course provides an introduction to probability and statistics, with emphasis on engineering applications. Course topics include events and their probability, the Total Probability and Bayes' Theorems, discrete and continuous random variables and vectors, uncertainty propagation and conditional analysis. Second-moment representation of uncertainty, random sampling, estimation of distribution parameters (method of moments, maximum likelihood, Bayesian estimation), and simple and multiple linear regression. Concepts illustrated with examples from various areas of engineering and everyday life.
This is a task from the Illustrative Mathematics website that is one …
This is a task from the Illustrative Mathematics website that is one part of a complete illustration of the standard to which it is aligned. Each task has at least one solution and some commentary that addresses important aspects of the task and its potential use.
For this task, Minitab software was used to generate 100 random samples …
For this task, Minitab software was used to generate 100 random samples of size 16 from a population where the probability of obtaining a success in one draw is 33.6% (Bernoulli). Given that multiple samples of the same size have been generated, students should note that there can be quite a bit of variability among the estimates from random samples and that on average, the center of the distribution of such estimates is at the actual population value and most of the estimates themselves tend to cluster around the actual population value.
As the standards in statistics and probability unfold, students will not yet …
As the standards in statistics and probability unfold, students will not yet know the rules of probability for compound events. Thus, simulation is used to find an approximate answer to these questions. In fact, part b would be a challenge to students who do know the rules of probability, further illustrating the power of simulation to provide relatively easy approximate answers to wide-ranging problems.
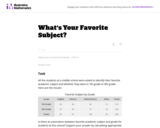
Students collect a large set of data (approximately 60 sets) of individual …
Students collect a large set of data (approximately 60 sets) of individual student’s water use and learn how to use spreadsheets to graph the data and find mean, median, mode, and range. They compared their findings to the national average of water use per person per day and use it to evaluate how much water a municipality would need in the event of a recovery from a water shutdown. This analysis activity introduces students to the concept of central tendencies and how to use spreadsheets to find them.
These open-source mathematics homework problems are programmed for the WeBWorK mathematics platform …
These open-source mathematics homework problems are programmed for the WeBWorK mathematics platform and correspond to chapters in OpenStax Introductory Statistics. They were created through a Round Eight Textbook Transformation Grant.
Students first explore different materials to see what types reduce the most …
Students first explore different materials to see what types reduce the most amount of sound when placed in a box. Each group is assigned a different material and they fill their box with that specific material. Students measure the sound level of a tone playing from inside the box using a decibel reader from outside the box. Students share this data with the class and analyze which types of materials absorb the most sound and which reflect the most sound.
Students act as food science engineers as they explore and apply their …
Students act as food science engineers as they explore and apply their understanding of cooling rate and specific heat capacity by completing two separate, but interconnected, tasks. In Part 1, student groups conduct an experiment to explore the cooling rate of a cup of hot chocolate. They collect and graph data to create a mathematical model that represents the cooling rate, and use an exponential decay regression to determine how long a person should wait to drink the cup of hot chocolate at an optimal temperature. In Part 2, students investigate the specific heat capacity of the hot chocolate. They determine how much energy is needed to heat the hot chocolate to an optimal temperature after it has cooled to room temperature. Two activity-guiding worksheets are included.
No restrictions on your remixing, redistributing, or making derivative works. Give credit to the author, as required.
Your remixing, redistributing, or making derivatives works comes with some restrictions, including how it is shared.
Your redistributing comes with some restrictions. Do not remix or make derivative works.
Most restrictive license type. Prohibits most uses, sharing, and any changes.
Copyrighted materials, available under Fair Use and the TEACH Act for US-based educators, or other custom arrangements. Go to the resource provider to see their individual restrictions.