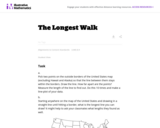
In this task students figure out how to draw the longest line …
In this task students figure out how to draw the longest line on a map of the United States without hitting a border. They use color and line plots to keep track of their results.
The purpose of this task is for students to compare two options …
The purpose of this task is for students to compare two options for a prize where the value of one is given $2 at a time, giving them an opportunity to "work with equal groups of objects to gain foundations for multiplication." This context also provides students with an introduction to the concept of delayed gratification, or resisting an immediate reward and waiting for a later reward, while working with money.
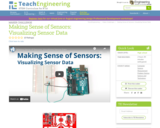
The goal of this maker challenge is to demystify sensors, in particular …
The goal of this maker challenge is to demystify sensors, in particular the ambient light sensor, and to map its readings visually. In today’s world, we make sense of the environment around us by filling it with sensors, and we use output devices to display real-time data in a meaningful way. Take any smartphone as an example. Aside from the embedded camera and microphone, a number of other sensors collect a wide range of data. Depending upon the model, these sensors may collect data on proximity, motion, ambient light, moisture, compass, and touch. Some of these data are directly visualized through an app, while many operate internally and without a user interface, just below the surface of the screen. In order to become more familiar with the technology that we use (and often take for granted) on a daily basis, your challenge is to assemble a light sensor circuit, observe its readings using the Arduino Serial Monitor, and then create your own unique visualization by interfacing with the Processing software. Students learn how to use calibration and smoothing to capture a better picture of the data. Afterwards, they share their visualizations with the entire class. The time required for this challenge depends on students’ prior knowledge of Arduino and Processing software. Background resources for beginners help students get up to speed on microcontroller hardware and offer additional challenges for intermediate and advanced users.
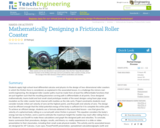
Students apply high school-level differential calculus and physics to the design of …
Students apply high school-level differential calculus and physics to the design of two-dimensional roller coasters in which the friction force is considered, as explained in the associated lesson. In a challenge the mirrors real-world engineering, the designed roller coaster paths must be made from at least five differentiable functions that are put together such that the resulting piecewise curving path is differentiable at all points. Once designed mathematically, teams build and test small-sized prototype models of the exact designs using foam pipe wrap insulation as the roller coaster track channel with marbles as the ride carts.
The purpose of the task is for students to solve a multi-step …
The purpose of the task is for students to solve a multi-step multiplication problem in a context that involves area. In addition, the numbers were chosen to determine if students have a common misconception related to multiplication.
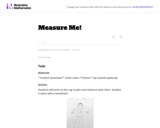
In this task students work with partners to measure themselves by laying …
In this task students work with partners to measure themselves by laying multiple copies of a shorter object that represents the length unit end to end. It gives students the opportunity to discuss the need to be careful when measuring.
Students learn the metric units engineers use to measure mass, distance (or …
Students learn the metric units engineers use to measure mass, distance (or length) and volume. They make estimations using these units and compare their guesses with actual values. To introduce the concepts, the teacher needs access to a meter stick, a one-liter bottle, a glass container that measures milliliters and a gram scale.
Students learn about the statistical analysis of measurements and error propagation, reviewing …
Students learn about the statistical analysis of measurements and error propagation, reviewing concepts of precision, accuracy and error types. This is done through calculations related to the concept of density. Students work in teams to each measure the dimensions and mass of five identical cubes, compile the measurements into small data sets, calculate statistics including the mean and standard deviation of these measurements, and use the mean values of the measurements to calculate density of the cubes. Then they use this calculated density to determine the mass of a new object made of the same material. This is done by measuring the appropriate dimensions of the new object, calculating its volume, and then calculating its mass using the density value. Next, the mass of the new object is measured by each student group and the standard deviation of the measurements is calculated. Finally, students determine the accuracy of the calculated mass by comparing it to the measured mass, determining whether the difference in the measurements is more or less than the standard deviation.
No restrictions on your remixing, redistributing, or making derivative works. Give credit to the author, as required.
Your remixing, redistributing, or making derivatives works comes with some restrictions, including how it is shared.
Your redistributing comes with some restrictions. Do not remix or make derivative works.
Most restrictive license type. Prohibits most uses, sharing, and any changes.
Copyrighted materials, available under Fair Use and the TEACH Act for US-based educators, or other custom arrangements. Go to the resource provider to see their individual restrictions.